Cherokee vs Bulgarian Vision Disability
COMPARE
Cherokee
Bulgarian
Vision Disability
Vision Disability Comparison
Cherokee
Bulgarians
2.9%
VISION DISABILITY
0.0/ 100
METRIC RATING
325th/ 347
METRIC RANK
1.9%
VISION DISABILITY
99.9/ 100
METRIC RATING
25th/ 347
METRIC RANK
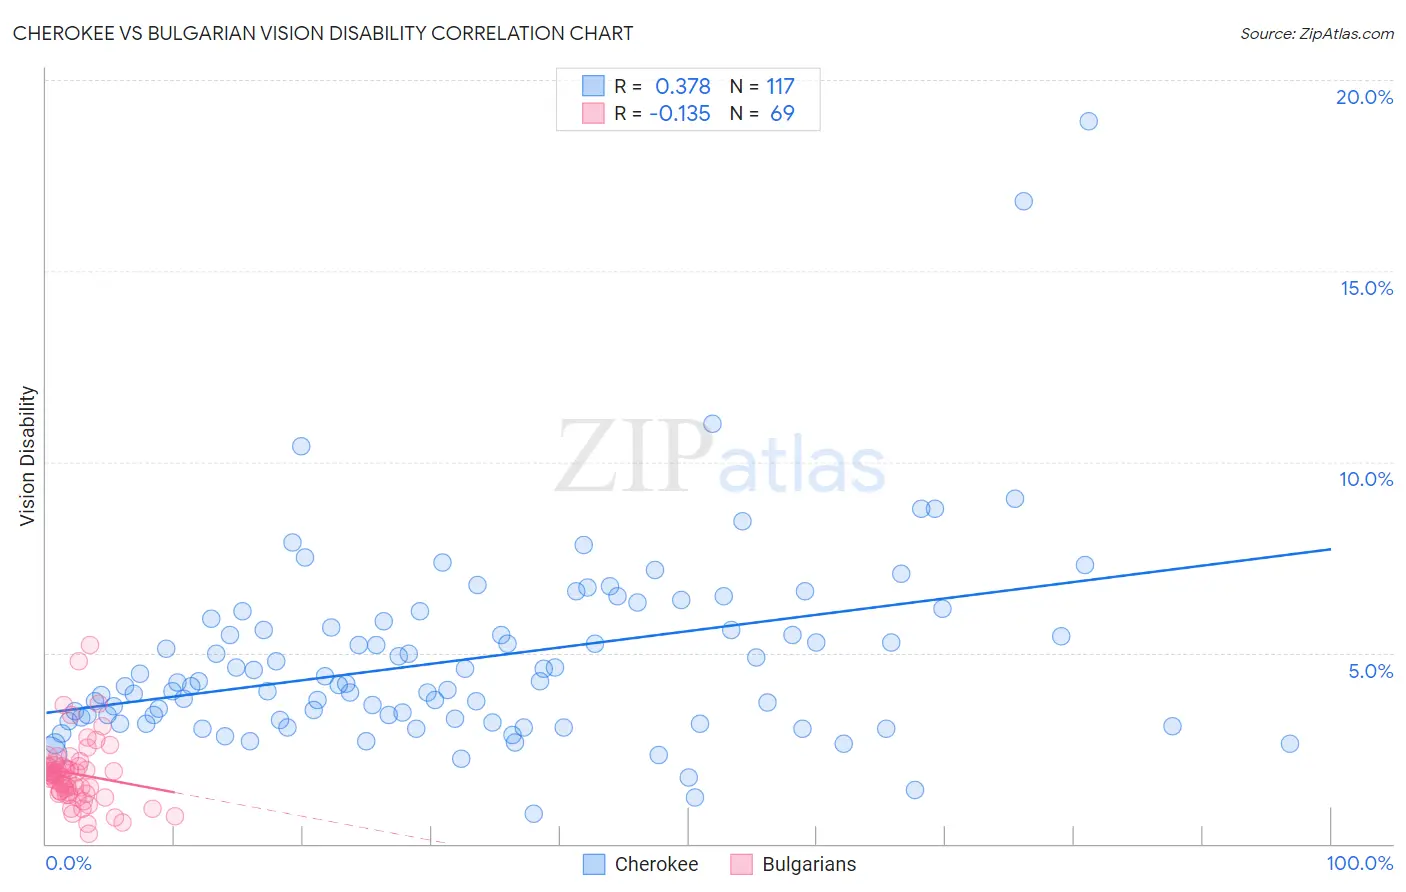
Cherokee vs Bulgarian Vision Disability Correlation Chart
The statistical analysis conducted on geographies consisting of 493,069,891 people shows a mild positive correlation between the proportion of Cherokee and percentage of population with vision disability in the United States with a correlation coefficient (R) of 0.378 and weighted average of 2.9%. Similarly, the statistical analysis conducted on geographies consisting of 205,563,576 people shows a poor negative correlation between the proportion of Bulgarians and percentage of population with vision disability in the United States with a correlation coefficient (R) of -0.135 and weighted average of 1.9%, a difference of 51.6%.
Vision Disability Correlation Summary
| Measurement | Cherokee | Bulgarian |
| Minimum | 0.78% | 0.26% |
| Maximum | 18.9% | 5.2% |
| Range | 18.1% | 4.9% |
| Mean | 4.8% | 1.8% |
| Median | 4.2% | 1.8% |
| Interquartile 25% (IQ1) | 3.2% | 1.3% |
| Interquartile 75% (IQ3) | 5.8% | 2.0% |
| Interquartile Range (IQR) | 2.5% | 0.69% |
| Standard Deviation (Sample) | 2.5% | 0.87% |
| Standard Deviation (Population) | 2.5% | 0.86% |
Similar Demographics by Vision Disability
Demographics Similar to Cherokee by Vision Disability
In terms of vision disability, the demographic groups most similar to Cherokee are Hopi (2.9%, a difference of 0.010%), Spanish American (2.9%, a difference of 1.2%), Native/Alaskan (3.0%, a difference of 2.0%), Tlingit-Haida (2.9%, a difference of 2.0%), and Paiute (2.9%, a difference of 2.0%).
| Demographics | Rating | Rank | Vision Disability |
| Alaska Natives | 0.0 /100 | #318 | Tragic 2.7% |
| Tohono O'odham | 0.0 /100 | #319 | Tragic 2.8% |
| Blacks/African Americans | 0.0 /100 | #320 | Tragic 2.8% |
| Comanche | 0.0 /100 | #321 | Tragic 2.8% |
| Paiute | 0.0 /100 | #322 | Tragic 2.9% |
| Tlingit-Haida | 0.0 /100 | #323 | Tragic 2.9% |
| Hopi | 0.0 /100 | #324 | Tragic 2.9% |
| Cherokee | 0.0 /100 | #325 | Tragic 2.9% |
| Spanish Americans | 0.0 /100 | #326 | Tragic 2.9% |
| Natives/Alaskans | 0.0 /100 | #327 | Tragic 3.0% |
| Yuman | 0.0 /100 | #328 | Tragic 3.0% |
| Apache | 0.0 /100 | #329 | Tragic 3.0% |
| Colville | 0.0 /100 | #330 | Tragic 3.0% |
| Central American Indians | 0.0 /100 | #331 | Tragic 3.0% |
| Seminole | 0.0 /100 | #332 | Tragic 3.1% |
Demographics Similar to Bulgarians by Vision Disability
In terms of vision disability, the demographic groups most similar to Bulgarians are Immigrants from Lithuania (1.9%, a difference of 0.040%), Immigrants from Japan (1.9%, a difference of 0.040%), Immigrants from Asia (1.9%, a difference of 0.16%), Taiwanese (1.9%, a difference of 0.37%), and Immigrants from Malaysia (1.9%, a difference of 0.40%).
| Demographics | Rating | Rank | Vision Disability |
| Bolivians | 100.0 /100 | #18 | Exceptional 1.9% |
| Immigrants | Sri Lanka | 100.0 /100 | #19 | Exceptional 1.9% |
| Asians | 100.0 /100 | #20 | Exceptional 1.9% |
| Turks | 100.0 /100 | #21 | Exceptional 1.9% |
| Immigrants | Pakistan | 100.0 /100 | #22 | Exceptional 1.9% |
| Immigrants | Asia | 99.9 /100 | #23 | Exceptional 1.9% |
| Immigrants | Lithuania | 99.9 /100 | #24 | Exceptional 1.9% |
| Bulgarians | 99.9 /100 | #25 | Exceptional 1.9% |
| Immigrants | Japan | 99.9 /100 | #26 | Exceptional 1.9% |
| Taiwanese | 99.9 /100 | #27 | Exceptional 1.9% |
| Immigrants | Malaysia | 99.9 /100 | #28 | Exceptional 1.9% |
| Egyptians | 99.9 /100 | #29 | Exceptional 1.9% |
| Immigrants | Nepal | 99.9 /100 | #30 | Exceptional 1.9% |
| Mongolians | 99.9 /100 | #31 | Exceptional 1.9% |
| Luxembourgers | 99.9 /100 | #32 | Exceptional 1.9% |