Belgian vs Immigrants from Sweden Cognitive Disability

COMPARE

Belgian
Race
Ancestry
AfghanAfricanAlaska NativeAlaskan AthabascanAlbanianAleutAlsatianAmericanApacheArabArapahoArgentineanArmenianAssyrian/Chaldean/SyriacAustralianAustrianBahamianBangladeshiBarbadianBasqueBelgianBelizeanBermudanBhutaneseBlackfeetBolivianBrazilianBritishBritish West IndianBulgarianBurmeseCajunCambodianCanadianCape VerdeanCarpatho RusynCelticCentral AmericanCentral American IndianCherokeeCheyenneChickasawChileanChineseChippewaChoctawColombianColvilleComancheCosta RicanCreeCreekCroatianCrowCubanCypriotCzechCzechoslovakianDanishDelawareDominicanDutchDutch West IndianEastern EuropeanEcuadorianEgyptianEnglishEstonianEthiopianEuropeanFijianFilipinoFinnishFrenchFrench American IndianFrench CanadianGermanGerman RussianGhanaianGreekGuamanian/ChamorroGuatemalanGuyaneseHaitianHmongHonduranHopiHoumaHungarianIcelanderIndian (Asian)IndonesianInupiatIranianIraqiIrishIroquoisIsraeliItalianJamaicanJapaneseJordanianKenyanKiowaKoreanLaotianLatvianLebaneseLiberianLithuanianLumbeeLuxembourgerMacedonianMalaysianMalteseMarshalleseMenomineeMexicanMexican American IndianMongolianMoroccanNative HawaiianNavajoNepaleseNew ZealanderNicaraguanNigerianNorthern EuropeanNorwegianOkinawanOsageOttawaPaiutePakistaniPalestinianPanamanianParaguayanPennsylvania GermanPeruvianPimaPolishPortuguesePotawatomiPuebloPuerto RicanPuget Sound SalishRomanianRussianSalvadoranSamoanScandinavianScotch-IrishScottishSeminoleSenegaleseSerbianShoshoneSierra LeoneanSiouxSlavicSlovakSloveneSomaliSouth AfricanSouth AmericanSouth American IndianSoviet UnionSpaniardSpanishSpanish AmericanSpanish American IndianSri LankanSubsaharan AfricanSudaneseSwedishSwissSyrianTaiwaneseThaiTlingit-HaidaTohono O'OdhamTonganTrinidadian and TobagonianTsimshianTurkishU.S. Virgin IslanderUgandanUkrainianUruguayanUteVenezuelanVietnameseWelshWest IndianYakamaYaquiYugoslavianYumanYup'ikZimbabwean
Immigration
NonimmigrantsImmigrantsAfghanistanAfricaAlbaniaArgentinaArmeniaAsiaAustraliaAustriaBahamasBangladeshBarbadosBelarusBelgiumBelizeBoliviaBosnia and HerzegovinaBrazilBulgariaBurma/MyanmarCabo VerdeCambodiaCameroonCanadaCaribbeanCentral AmericaChileChinaColombiaCongoCosta RicaCroatiaCubaCzechoslovakiaDenmarkDominicaDominican RepublicEastern AfricaEastern AsiaEastern EuropeEcuadorEgyptEl SalvadorEnglandEritreaEthiopiaEuropeFijiFranceGermanyGhanaGreeceGrenadaGuatemalaGuyanaHaitiHondurasHong KongHungaryIndiaIndonesiaIranIraqIrelandIsraelItalyJamaicaJapanJordanKazakhstanKenyaKoreaKuwaitLaosLatin AmericaLatviaLebanonLiberiaLithuaniaMalaysiaMexicoMicronesiaMiddle AfricaMoldovaMoroccoNepalNetherlandsNicaraguaNigeriaNorth AmericaNorth MacedoniaNorthern AfricaNorthern EuropeNorwayOceaniaPakistanPanamaPeruPhilippinesPolandPortugalRomaniaRussiaSaudi ArabiaScotlandSenegalSerbiaSierra LeoneSingaporeSomaliaSouth AfricaSouth AmericaSouth Central AsiaSouth Eastern AsiaSouthern EuropeSpainSri LankaSt. Vincent and the GrenadinesSudanSwitzerlandSyriaTaiwanThailandTrinidad and TobagoTurkeyUgandaUkraineUruguayUzbekistanVenezuelaVietnamWest IndiesWestern AfricaWestern AsiaWestern EuropeYemenZaireZimbabweAzores
Immigrants from Sweden
Race
Ancestry
AfghanAfricanAlaska NativeAlaskan AthabascanAlbanianAleutAlsatianAmericanApacheArabArapahoArgentineanArmenianAssyrian/Chaldean/SyriacAustralianAustrianBahamianBangladeshiBarbadianBasqueBelizeanBermudanBhutaneseBlackfeetBolivianBrazilianBritishBritish West IndianBulgarianBurmeseCajunCambodianCanadianCape VerdeanCarpatho RusynCelticCentral AmericanCentral American IndianCherokeeCheyenneChickasawChileanChineseChippewaChoctawColombianColvilleComancheCosta RicanCreeCreekCroatianCrowCubanCypriotCzechCzechoslovakianDanishDelawareDominicanDutchDutch West IndianEastern EuropeanEcuadorianEgyptianEnglishEstonianEthiopianEuropeanFijianFilipinoFinnishFrenchFrench American IndianFrench CanadianGermanGerman RussianGhanaianGreekGuamanian/ChamorroGuatemalanGuyaneseHaitianHmongHonduranHopiHoumaHungarianIcelanderIndian (Asian)IndonesianInupiatIranianIraqiIrishIroquoisIsraeliItalianJamaicanJapaneseJordanianKenyanKiowaKoreanLaotianLatvianLebaneseLiberianLithuanianLumbeeLuxembourgerMacedonianMalaysianMalteseMarshalleseMenomineeMexicanMexican American IndianMongolianMoroccanNative HawaiianNavajoNepaleseNew ZealanderNicaraguanNigerianNorthern EuropeanNorwegianOkinawanOsageOttawaPaiutePakistaniPalestinianPanamanianParaguayanPennsylvania GermanPeruvianPimaPolishPortuguesePotawatomiPuebloPuerto RicanPuget Sound SalishRomanianRussianSalvadoranSamoanScandinavianScotch-IrishScottishSeminoleSenegaleseSerbianShoshoneSierra LeoneanSiouxSlavicSlovakSloveneSomaliSouth AfricanSouth AmericanSouth American IndianSoviet UnionSpaniardSpanishSpanish AmericanSpanish American IndianSri LankanSubsaharan AfricanSudaneseSwedishSwissSyrianTaiwaneseThaiTlingit-HaidaTohono O'OdhamTonganTrinidadian and TobagonianTsimshianTurkishU.S. Virgin IslanderUgandanUkrainianUruguayanUteVenezuelanVietnameseWelshWest IndianYakamaYaquiYugoslavianYumanYup'ikZimbabwean
Immigration
NonimmigrantsImmigrantsAfghanistanAfricaAlbaniaArgentinaArmeniaAsiaAustraliaAustriaBahamasBangladeshBarbadosBelarusBelgiumBelizeBoliviaBosnia and HerzegovinaBrazilBulgariaBurma/MyanmarCabo VerdeCambodiaCameroonCanadaCaribbeanCentral AmericaChileChinaColombiaCongoCosta RicaCroatiaCubaCzechoslovakiaDenmarkDominicaDominican RepublicEastern AfricaEastern AsiaEastern EuropeEcuadorEgyptEl SalvadorEnglandEritreaEthiopiaEuropeFijiFranceGermanyGhanaGreeceGrenadaGuatemalaGuyanaHaitiHondurasHong KongHungaryIndiaIndonesiaIranIraqIrelandIsraelItalyJamaicaJapanJordanKazakhstanKenyaKoreaKuwaitLaosLatin AmericaLatviaLebanonLiberiaLithuaniaMalaysiaMexicoMicronesiaMiddle AfricaMoldovaMoroccoNepalNetherlandsNicaraguaNigeriaNorth AmericaNorth MacedoniaNorthern AfricaNorthern EuropeNorwayOceaniaPakistanPanamaPeruPhilippinesPolandPortugalRomaniaRussiaSaudi ArabiaScotlandSenegalSerbiaSierra LeoneSingaporeSomaliaSouth AfricaSouth AmericaSouth Central AsiaSouth Eastern AsiaSouthern EuropeSpainSri LankaSt. Vincent and the GrenadinesSudanSwedenSwitzerlandSyriaTaiwanThailandTrinidad and TobagoTurkeyUgandaUkraineUruguayUzbekistanVenezuelaVietnamWest IndiesWestern AfricaWestern AsiaWestern EuropeYemenZaireZimbabweAzores
Cognitive Disability
Income
Poverty
Unemployment
Labor Participation
Family Structure
Vehicle Availability
Education Level
Disability

Cognitive Disability Comparison

Belgians

Immigrants from Sweden

Exceptional
Exceptional
16.7%
COGNITIVE DISABILITY
99.1/ 100
METRIC RATING
84th/ 347
METRIC RANK
16.7%
COGNITIVE DISABILITY
99.4/ 100
METRIC RATING
70th/ 347
METRIC RANK

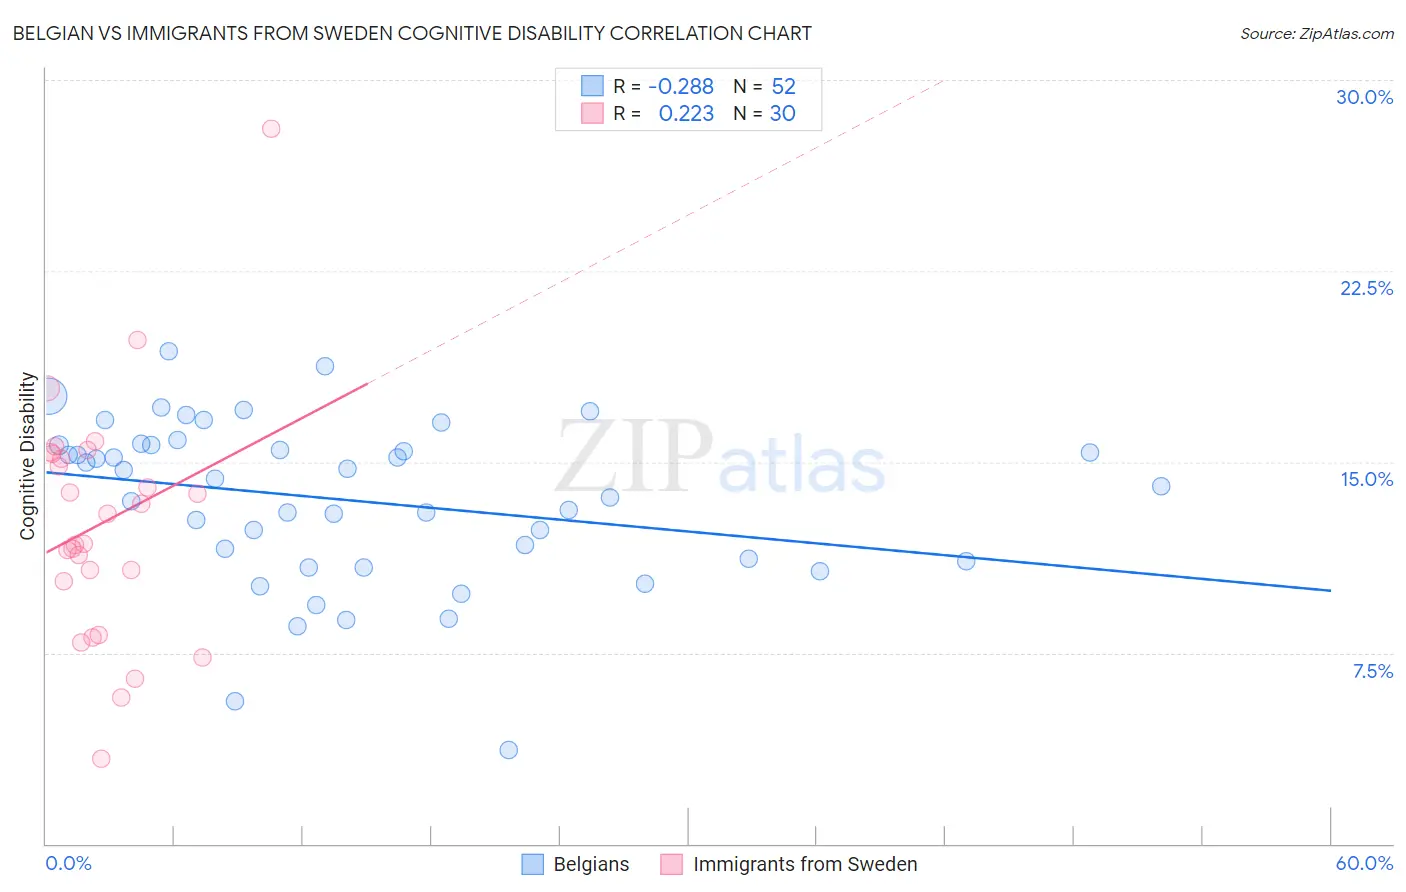
Belgian vs Immigrants from Sweden Cognitive Disability Correlation Chart

The statistical analysis conducted on geographies consisting of 355,993,312 people shows a weak negative correlation between the proportion of Belgians and percentage of population with cognitive disability in the United States with a correlation coefficient (R) of -0.288 and weighted average of 16.7%. Similarly, the statistical analysis conducted on geographies consisting of 164,746,937 people shows a weak positive correlation between the proportion of Immigrants from Sweden and percentage of population with cognitive disability in the United States with a correlation coefficient (R) of 0.223 and weighted average of 16.7%, a difference of 0.24%.
Belgian vs Immigrants from Sweden Cognitive Disability

Cognitive Disability Correlation Summary

MeasurementBelgianImmigrants from Sweden
Minimum3.7%3.4%
Maximum19.4%28.1%
Range15.7%24.7%
Mean13.5%12.6%
Median14.2%12.4%
Interquartile 25% (IQ1)11.1%10.3%
Interquartile 75% (IQ3)15.6%15.3%
Interquartile Range (IQR)4.5%5.0%
Standard Deviation (Sample)3.2%4.8%
Standard Deviation (Population)3.2%4.7%

Demographics Similar to Belgians and Immigrants from Sweden by Cognitive Disability

In terms of cognitive disability, the demographic groups most similar to Belgians are Serbian (16.7%, a difference of 0.020%), Immigrants from Moldova (16.7%, a difference of 0.020%), Immigrants from South Africa (16.7%, a difference of 0.050%), Native Hawaiian (16.7%, a difference of 0.060%), and Swiss (16.7%, a difference of 0.090%). Similarly, the demographic groups most similar to Immigrants from Sweden are Immigrants from Uzbekistan (16.7%, a difference of 0.010%), Immigrants from Belgium (16.7%, a difference of 0.010%), German (16.7%, a difference of 0.020%), Burmese (16.7%, a difference of 0.030%), and Slavic (16.7%, a difference of 0.030%).
DemographicsRating | RankCognitive Disability
Latvians
99.5
/100
|
#67
Exceptional
16.6%
Ukrainians
99.4
/100
|
#68
Exceptional
16.6%
Immigrants | Uzbekistan
99.4
/100
|
#69
Exceptional
16.7%
Immigrants | Sweden
99.4
/100
|
#70
Exceptional
16.7%
Immigrants | Belgium
99.3
/100
|
#71
Exceptional
16.7%
Germans
99.3
/100
|
#72
Exceptional
16.7%
Burmese
99.3
/100
|
#73
Exceptional
16.7%
Slavs
99.3
/100
|
#74
Exceptional
16.7%
Estonians
99.3
/100
|
#75
Exceptional
16.7%
Immigrants | Serbia
99.3
/100
|
#76
Exceptional
16.7%
Immigrants | Hungary
99.3
/100
|
#77
Exceptional
16.7%
Peruvians
99.3
/100
|
#78
Exceptional
16.7%
Immigrants | Bulgaria
99.3
/100
|
#79
Exceptional
16.7%
Egyptians
99.2
/100
|
#80
Exceptional
16.7%
Immigrants | Netherlands
99.2
/100
|
#81
Exceptional
16.7%
Swiss
99.2
/100
|
#82
Exceptional
16.7%
Serbians
99.1
/100
|
#83
Exceptional
16.7%
Belgians
99.1
/100
|
#84
Exceptional
16.7%
Immigrants | Moldova
99.1
/100
|
#85
Exceptional
16.7%
Immigrants | South Africa
99.0
/100
|
#86
Exceptional
16.7%
Native Hawaiians
99.0
/100
|
#87
Exceptional
16.7%