Central American Indian vs Alaska Native Unemployment Among Ages 55 to 59 years
COMPARE
Central American Indian
Alaska Native
Unemployment Among Ages 55 to 59 years
Unemployment Among Ages 55 to 59 years Comparison
Central American Indians
Alaska Natives
5.6%
UNEMPLOYMENT AMONG AGES 55 TO 59 YEARS
0.0/ 100
METRIC RATING
313th/ 347
METRIC RANK
6.2%
UNEMPLOYMENT AMONG AGES 55 TO 59 YEARS
0.0/ 100
METRIC RATING
330th/ 347
METRIC RANK
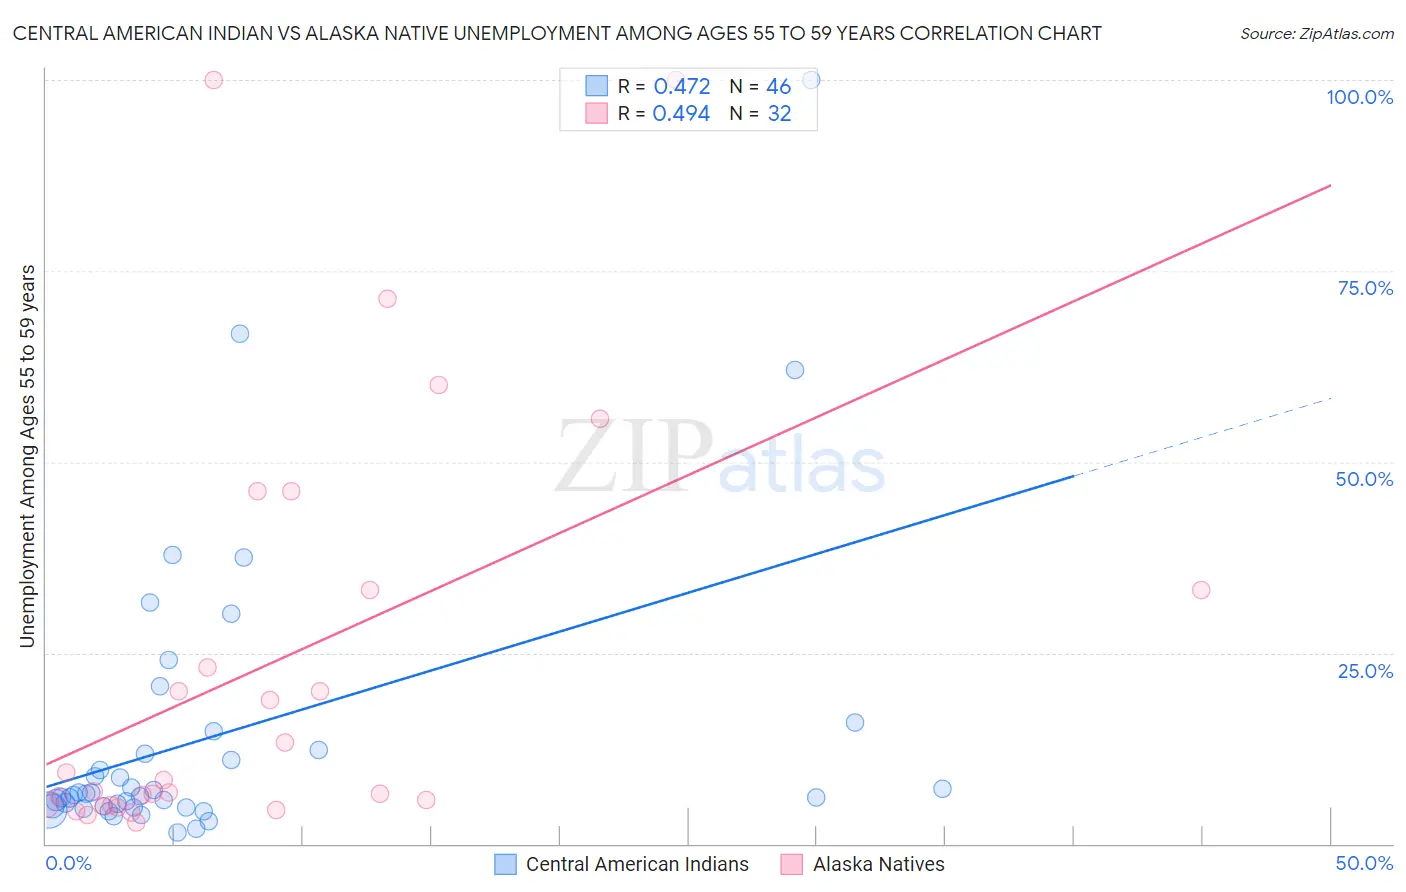
Central American Indian vs Alaska Native Unemployment Among Ages 55 to 59 years Correlation Chart
The statistical analysis conducted on geographies consisting of 309,997,703 people shows a moderate positive correlation between the proportion of Central American Indians and unemployment rate among population between the ages 55 and 59 in the United States with a correlation coefficient (R) of 0.472 and weighted average of 5.6%. Similarly, the statistical analysis conducted on geographies consisting of 74,675,263 people shows a moderate positive correlation between the proportion of Alaska Natives and unemployment rate among population between the ages 55 and 59 in the United States with a correlation coefficient (R) of 0.494 and weighted average of 6.2%, a difference of 10.6%.
Unemployment Among Ages 55 to 59 years Correlation Summary
| Measurement | Central American Indian | Alaska Native |
| Minimum | 1.4% | 2.8% |
| Maximum | 100.0% | 100.0% |
| Range | 98.6% | 97.2% |
| Mean | 14.2% | 23.2% |
| Median | 6.5% | 7.6% |
| Interquartile 25% (IQ1) | 4.9% | 5.0% |
| Interquartile 75% (IQ3) | 12.2% | 33.3% |
| Interquartile Range (IQR) | 7.3% | 28.3% |
| Standard Deviation (Sample) | 19.3% | 27.5% |
| Standard Deviation (Population) | 19.1% | 27.1% |
Demographics Similar to Central American Indians and Alaska Natives by Unemployment Among Ages 55 to 59 years
In terms of unemployment among ages 55 to 59 years, the demographic groups most similar to Central American Indians are Ecuadorian (5.6%, a difference of 0.19%), Tlingit-Haida (5.7%, a difference of 0.29%), Houma (5.6%, a difference of 0.41%), Guyanese (5.7%, a difference of 0.44%), and Immigrants from Ecuador (5.7%, a difference of 0.63%). Similarly, the demographic groups most similar to Alaska Natives are Dominican (6.2%, a difference of 0.43%), Immigrants from Dominican Republic (6.3%, a difference of 0.68%), Yuman (6.1%, a difference of 1.9%), Arapaho (6.1%, a difference of 3.1%), and Native/Alaskan (6.0%, a difference of 4.0%).
| Demographics | Rating | Rank | Unemployment Among Ages 55 to 59 years |
| Houma | 0.0 /100 | #311 | Tragic 5.6% |
| Ecuadorians | 0.0 /100 | #312 | Tragic 5.6% |
| Central American Indians | 0.0 /100 | #313 | Tragic 5.6% |
| Tlingit-Haida | 0.0 /100 | #314 | Tragic 5.7% |
| Guyanese | 0.0 /100 | #315 | Tragic 5.7% |
| Immigrants | Ecuador | 0.0 /100 | #316 | Tragic 5.7% |
| Hmong | 0.0 /100 | #317 | Tragic 5.7% |
| Immigrants | Guyana | 0.0 /100 | #318 | Tragic 5.8% |
| Kiowa | 0.0 /100 | #319 | Tragic 5.8% |
| Immigrants | Azores | 0.0 /100 | #320 | Tragic 5.8% |
| Chippewa | 0.0 /100 | #321 | Tragic 5.9% |
| Crow | 0.0 /100 | #322 | Tragic 5.9% |
| Immigrants | Bangladesh | 0.0 /100 | #323 | Tragic 5.9% |
| Vietnamese | 0.0 /100 | #324 | Tragic 5.9% |
| Immigrants | Armenia | 0.0 /100 | #325 | Tragic 6.0% |
| Natives/Alaskans | 0.0 /100 | #326 | Tragic 6.0% |
| Arapaho | 0.0 /100 | #327 | Tragic 6.1% |
| Yuman | 0.0 /100 | #328 | Tragic 6.1% |
| Dominicans | 0.0 /100 | #329 | Tragic 6.2% |
| Alaska Natives | 0.0 /100 | #330 | Tragic 6.2% |
| Immigrants | Dominican Republic | 0.0 /100 | #331 | Tragic 6.3% |