Celtic vs Immigrants from Iran Disability Age Over 75
COMPARE
Celtic
Immigrants from Iran
Disability Age Over 75
Disability Age Over 75 Comparison
Celtics
Immigrants from Iran
47.2%
DISABILITY AGE OVER 75
58.7/ 100
METRIC RATING
169th/ 347
METRIC RANK
47.1%
DISABILITY AGE OVER 75
74.7/ 100
METRIC RATING
155th/ 347
METRIC RANK
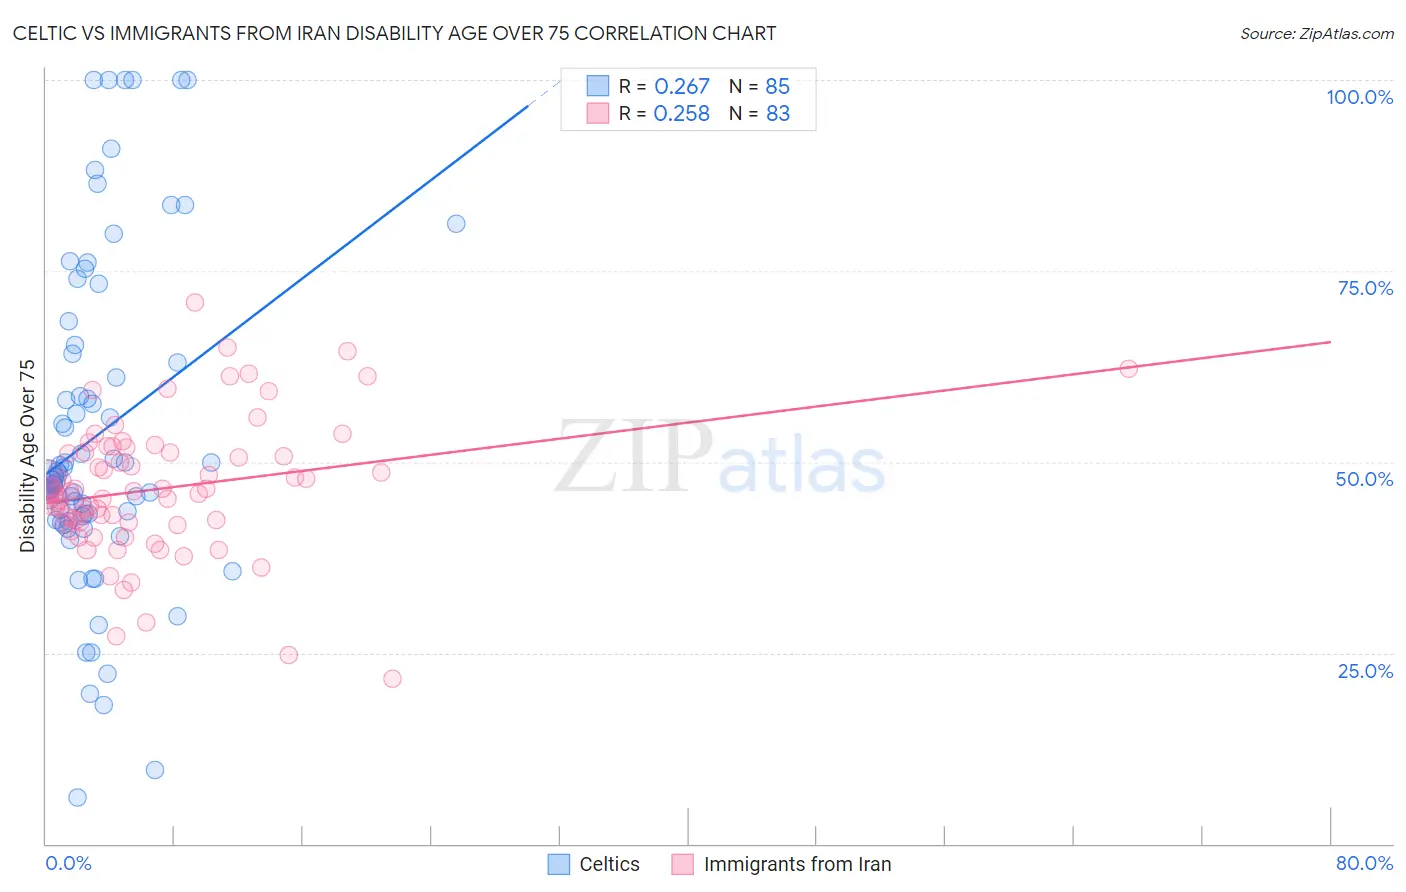
Celtic vs Immigrants from Iran Disability Age Over 75 Correlation Chart
The statistical analysis conducted on geographies consisting of 168,767,238 people shows a weak positive correlation between the proportion of Celtics and percentage of population with a disability over the age of 75 in the United States with a correlation coefficient (R) of 0.267 and weighted average of 47.2%. Similarly, the statistical analysis conducted on geographies consisting of 279,744,511 people shows a weak positive correlation between the proportion of Immigrants from Iran and percentage of population with a disability over the age of 75 in the United States with a correlation coefficient (R) of 0.258 and weighted average of 47.1%, a difference of 0.41%.
Disability Age Over 75 Correlation Summary
| Measurement | Celtic | Immigrants from Iran |
| Minimum | 6.0% | 21.6% |
| Maximum | 100.0% | 70.8% |
| Range | 94.0% | 49.3% |
| Mean | 53.5% | 46.5% |
| Median | 47.6% | 46.1% |
| Interquartile 25% (IQ1) | 42.6% | 42.1% |
| Interquartile 75% (IQ3) | 63.6% | 51.2% |
| Interquartile Range (IQR) | 21.0% | 9.2% |
| Standard Deviation (Sample) | 21.1% | 8.8% |
| Standard Deviation (Population) | 21.0% | 8.8% |
Demographics Similar to Celtics and Immigrants from Iran by Disability Age Over 75
In terms of disability age over 75, the demographic groups most similar to Celtics are Kenyan (47.2%, a difference of 0.0%), German Russian (47.3%, a difference of 0.060%), Moroccan (47.2%, a difference of 0.10%), Immigrants from Africa (47.3%, a difference of 0.12%), and Immigrants from Sierra Leone (47.2%, a difference of 0.13%). Similarly, the demographic groups most similar to Immigrants from Iran are Immigrants from Belarus (47.1%, a difference of 0.0%), Immigrants from Zaire (47.1%, a difference of 0.010%), Arab (47.1%, a difference of 0.040%), Immigrants from Asia (47.0%, a difference of 0.060%), and Bhutanese (47.1%, a difference of 0.060%).
| Demographics | Rating | Rank | Disability Age Over 75 |
| Immigrants | Asia | 76.5 /100 | #152 | Good 47.0% |
| Immigrants | Zaire | 74.8 /100 | #153 | Good 47.1% |
| Immigrants | Belarus | 74.8 /100 | #154 | Good 47.1% |
| Immigrants | Iran | 74.7 /100 | #155 | Good 47.1% |
| Arabs | 73.3 /100 | #156 | Good 47.1% |
| Bhutanese | 72.6 /100 | #157 | Good 47.1% |
| Immigrants | Guyana | 71.9 /100 | #158 | Good 47.1% |
| Immigrants | Morocco | 71.4 /100 | #159 | Good 47.1% |
| Immigrants | Middle Africa | 68.3 /100 | #160 | Good 47.1% |
| South American Indians | 68.1 /100 | #161 | Good 47.1% |
| Pennsylvania Germans | 66.0 /100 | #162 | Good 47.2% |
| Immigrants | Eastern Africa | 65.5 /100 | #163 | Good 47.2% |
| French | 64.6 /100 | #164 | Good 47.2% |
| Immigrants | Zimbabwe | 64.4 /100 | #165 | Good 47.2% |
| Immigrants | Sierra Leone | 64.4 /100 | #166 | Good 47.2% |
| Moroccans | 62.9 /100 | #167 | Good 47.2% |
| Kenyans | 58.8 /100 | #168 | Average 47.2% |
| Celtics | 58.7 /100 | #169 | Average 47.2% |
| German Russians | 56.2 /100 | #170 | Average 47.3% |
| Immigrants | Africa | 53.6 /100 | #171 | Average 47.3% |
| Scotch-Irish | 52.5 /100 | #172 | Average 47.3% |