Celtic vs Cape Verdean Disability Age Over 75
COMPARE
Celtic
Cape Verdean
Disability Age Over 75
Disability Age Over 75 Comparison
Celtics
Cape Verdeans
47.2%
DISABILITY AGE OVER 75
58.7/ 100
METRIC RATING
169th/ 347
METRIC RANK
50.1%
DISABILITY AGE OVER 75
0.0/ 100
METRIC RATING
300th/ 347
METRIC RANK
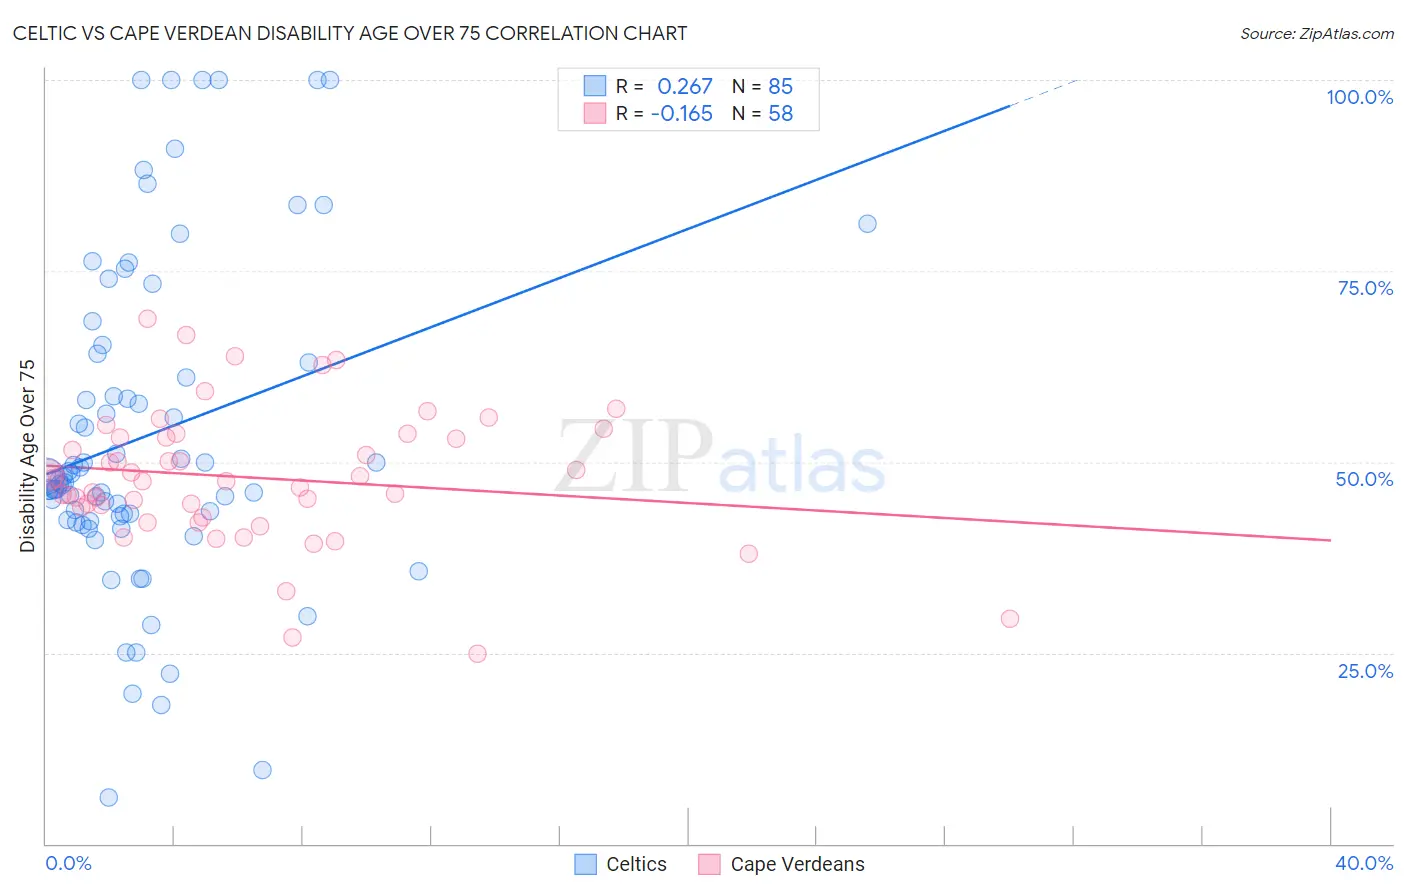
Celtic vs Cape Verdean Disability Age Over 75 Correlation Chart
The statistical analysis conducted on geographies consisting of 168,767,238 people shows a weak positive correlation between the proportion of Celtics and percentage of population with a disability over the age of 75 in the United States with a correlation coefficient (R) of 0.267 and weighted average of 47.2%. Similarly, the statistical analysis conducted on geographies consisting of 107,500,329 people shows a poor negative correlation between the proportion of Cape Verdeans and percentage of population with a disability over the age of 75 in the United States with a correlation coefficient (R) of -0.165 and weighted average of 50.1%, a difference of 6.1%.
Disability Age Over 75 Correlation Summary
| Measurement | Celtic | Cape Verdean |
| Minimum | 6.0% | 24.9% |
| Maximum | 100.0% | 68.8% |
| Range | 94.0% | 43.8% |
| Mean | 53.5% | 47.9% |
| Median | 47.6% | 47.7% |
| Interquartile 25% (IQ1) | 42.6% | 44.0% |
| Interquartile 75% (IQ3) | 63.6% | 53.2% |
| Interquartile Range (IQR) | 21.0% | 9.2% |
| Standard Deviation (Sample) | 21.1% | 8.8% |
| Standard Deviation (Population) | 21.0% | 8.7% |
Similar Demographics by Disability Age Over 75
Demographics Similar to Celtics by Disability Age Over 75
In terms of disability age over 75, the demographic groups most similar to Celtics are Kenyan (47.2%, a difference of 0.0%), German Russian (47.3%, a difference of 0.060%), Moroccan (47.2%, a difference of 0.10%), Immigrants from Africa (47.3%, a difference of 0.12%), and Immigrants from Sierra Leone (47.2%, a difference of 0.13%).
| Demographics | Rating | Rank | Disability Age Over 75 |
| Pennsylvania Germans | 66.0 /100 | #162 | Good 47.2% |
| Immigrants | Eastern Africa | 65.5 /100 | #163 | Good 47.2% |
| French | 64.6 /100 | #164 | Good 47.2% |
| Immigrants | Zimbabwe | 64.4 /100 | #165 | Good 47.2% |
| Immigrants | Sierra Leone | 64.4 /100 | #166 | Good 47.2% |
| Moroccans | 62.9 /100 | #167 | Good 47.2% |
| Kenyans | 58.8 /100 | #168 | Average 47.2% |
| Celtics | 58.7 /100 | #169 | Average 47.2% |
| German Russians | 56.2 /100 | #170 | Average 47.3% |
| Immigrants | Africa | 53.6 /100 | #171 | Average 47.3% |
| Scotch-Irish | 52.5 /100 | #172 | Average 47.3% |
| Alsatians | 51.9 /100 | #173 | Average 47.3% |
| Whites/Caucasians | 50.0 /100 | #174 | Average 47.3% |
| Immigrants | Haiti | 49.7 /100 | #175 | Average 47.3% |
| Ecuadorians | 46.7 /100 | #176 | Average 47.4% |
Demographics Similar to Cape Verdeans by Disability Age Over 75
In terms of disability age over 75, the demographic groups most similar to Cape Verdeans are Immigrants from Micronesia (50.1%, a difference of 0.040%), Dominican (50.2%, a difference of 0.060%), Marshallese (50.1%, a difference of 0.10%), Armenian (50.0%, a difference of 0.16%), and Mexican American Indian (50.0%, a difference of 0.19%).
| Demographics | Rating | Rank | Disability Age Over 75 |
| Spanish American Indians | 0.0 /100 | #293 | Tragic 49.9% |
| Immigrants | Cambodia | 0.0 /100 | #294 | Tragic 50.0% |
| Spanish Americans | 0.0 /100 | #295 | Tragic 50.0% |
| Mexican American Indians | 0.0 /100 | #296 | Tragic 50.0% |
| Armenians | 0.0 /100 | #297 | Tragic 50.0% |
| Marshallese | 0.0 /100 | #298 | Tragic 50.1% |
| Immigrants | Micronesia | 0.0 /100 | #299 | Tragic 50.1% |
| Cape Verdeans | 0.0 /100 | #300 | Tragic 50.1% |
| Dominicans | 0.0 /100 | #301 | Tragic 50.2% |
| Cherokee | 0.0 /100 | #302 | Tragic 50.2% |
| Japanese | 0.0 /100 | #303 | Tragic 50.2% |
| Immigrants | Dominican Republic | 0.0 /100 | #304 | Tragic 50.3% |
| Central American Indians | 0.0 /100 | #305 | Tragic 50.5% |
| Immigrants | Central America | 0.0 /100 | #306 | Tragic 50.5% |
| Immigrants | Fiji | 0.0 /100 | #307 | Tragic 50.6% |