Alsatian vs Jamaican Cognitive Disability
COMPARE
Alsatian
Jamaican
Cognitive Disability
Cognitive Disability Comparison
Alsatians
Jamaicans
17.7%
COGNITIVE DISABILITY
4.5/ 100
METRIC RATING
223rd/ 347
METRIC RANK
17.9%
COGNITIVE DISABILITY
0.9/ 100
METRIC RATING
244th/ 347
METRIC RANK
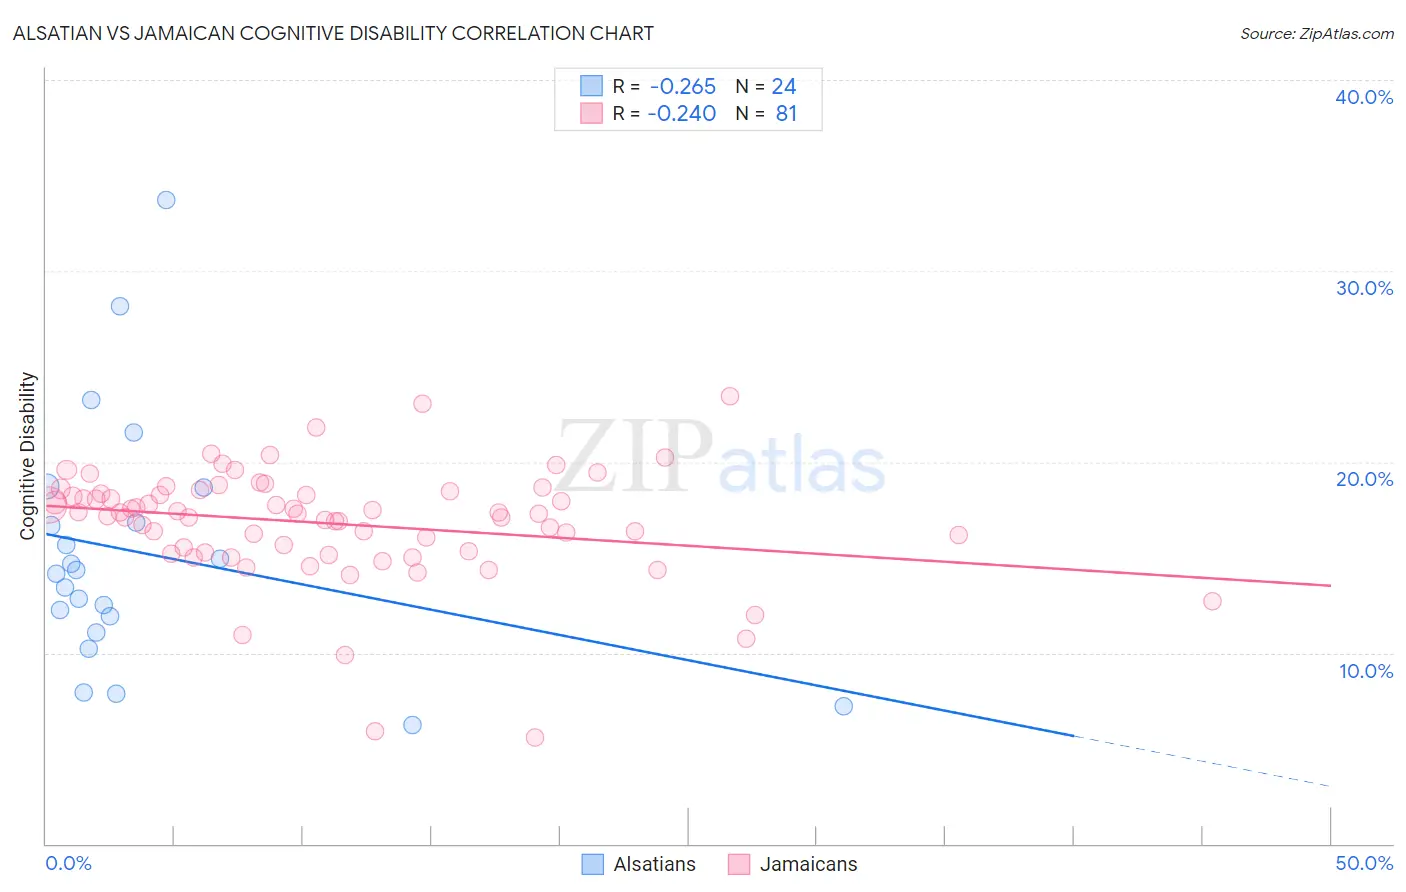
Alsatian vs Jamaican Cognitive Disability Correlation Chart
The statistical analysis conducted on geographies consisting of 82,682,247 people shows a weak negative correlation between the proportion of Alsatians and percentage of population with cognitive disability in the United States with a correlation coefficient (R) of -0.265 and weighted average of 17.7%. Similarly, the statistical analysis conducted on geographies consisting of 367,984,086 people shows a weak negative correlation between the proportion of Jamaicans and percentage of population with cognitive disability in the United States with a correlation coefficient (R) of -0.240 and weighted average of 17.9%, a difference of 1.1%.
Cognitive Disability Correlation Summary
| Measurement | Alsatian | Jamaican |
| Minimum | 6.2% | 5.6% |
| Maximum | 33.7% | 23.5% |
| Range | 27.5% | 17.9% |
| Mean | 15.2% | 16.8% |
| Median | 14.3% | 17.3% |
| Interquartile 25% (IQ1) | 11.5% | 15.3% |
| Interquartile 75% (IQ3) | 17.7% | 18.4% |
| Interquartile Range (IQR) | 6.2% | 3.1% |
| Standard Deviation (Sample) | 6.5% | 3.0% |
| Standard Deviation (Population) | 6.4% | 3.0% |
Similar Demographics by Cognitive Disability
Demographics Similar to Alsatians by Cognitive Disability
In terms of cognitive disability, the demographic groups most similar to Alsatians are Central American (17.7%, a difference of 0.010%), Fijian (17.7%, a difference of 0.19%), Vietnamese (17.7%, a difference of 0.20%), Moroccan (17.6%, a difference of 0.21%), and Zimbabwean (17.6%, a difference of 0.22%).
| Demographics | Rating | Rank | Cognitive Disability |
| Okinawans | 6.8 /100 | #216 | Tragic 17.6% |
| Salvadorans | 6.7 /100 | #217 | Tragic 17.6% |
| Icelanders | 6.4 /100 | #218 | Tragic 17.6% |
| Immigrants | Sierra Leone | 6.3 /100 | #219 | Tragic 17.6% |
| Zimbabweans | 6.1 /100 | #220 | Tragic 17.6% |
| Moroccans | 5.9 /100 | #221 | Tragic 17.6% |
| Central Americans | 4.5 /100 | #222 | Tragic 17.7% |
| Alsatians | 4.5 /100 | #223 | Tragic 17.7% |
| Fijians | 3.4 /100 | #224 | Tragic 17.7% |
| Vietnamese | 3.4 /100 | #225 | Tragic 17.7% |
| Marshallese | 2.7 /100 | #226 | Tragic 17.7% |
| Immigrants | St. Vincent and the Grenadines | 2.6 /100 | #227 | Tragic 17.7% |
| Immigrants | Central America | 2.3 /100 | #228 | Tragic 17.7% |
| Immigrants | Guatemala | 2.2 /100 | #229 | Tragic 17.7% |
| Mongolians | 2.2 /100 | #230 | Tragic 17.7% |
Demographics Similar to Jamaicans by Cognitive Disability
In terms of cognitive disability, the demographic groups most similar to Jamaicans are Immigrants from Bangladesh (17.8%, a difference of 0.040%), Trinidadian and Tobagonian (17.9%, a difference of 0.090%), Paiute (17.8%, a difference of 0.11%), Immigrants from Thailand (17.9%, a difference of 0.12%), and Mexican (17.8%, a difference of 0.13%).
| Demographics | Rating | Rank | Cognitive Disability |
| Immigrants | Mexico | 1.8 /100 | #237 | Tragic 17.8% |
| Cheyenne | 1.7 /100 | #238 | Tragic 17.8% |
| Cajuns | 1.4 /100 | #239 | Tragic 17.8% |
| Iraqis | 1.4 /100 | #240 | Tragic 17.8% |
| Mexicans | 1.1 /100 | #241 | Tragic 17.8% |
| Paiute | 1.1 /100 | #242 | Tragic 17.8% |
| Immigrants | Bangladesh | 1.0 /100 | #243 | Tragic 17.8% |
| Jamaicans | 0.9 /100 | #244 | Tragic 17.9% |
| Trinidadians and Tobagonians | 0.8 /100 | #245 | Tragic 17.9% |
| Immigrants | Thailand | 0.8 /100 | #246 | Tragic 17.9% |
| Samoans | 0.7 /100 | #247 | Tragic 17.9% |
| French American Indians | 0.7 /100 | #248 | Tragic 17.9% |
| Cree | 0.7 /100 | #249 | Tragic 17.9% |
| Immigrants | Ethiopia | 0.7 /100 | #250 | Tragic 17.9% |
| Malaysians | 0.6 /100 | #251 | Tragic 17.9% |