Celtic vs Iraqi In Labor Force | Age 30-34
COMPARE
Celtic
Iraqi
In Labor Force | Age 30-34
In Labor Force | Age 30-34 Comparison
Celtics
Iraqis
84.1%
IN LABOR FORCE | AGE 30-34
1.4/ 100
METRIC RATING
237th/ 347
METRIC RANK
83.8%
IN LABOR FORCE | AGE 30-34
0.3/ 100
METRIC RATING
257th/ 347
METRIC RANK
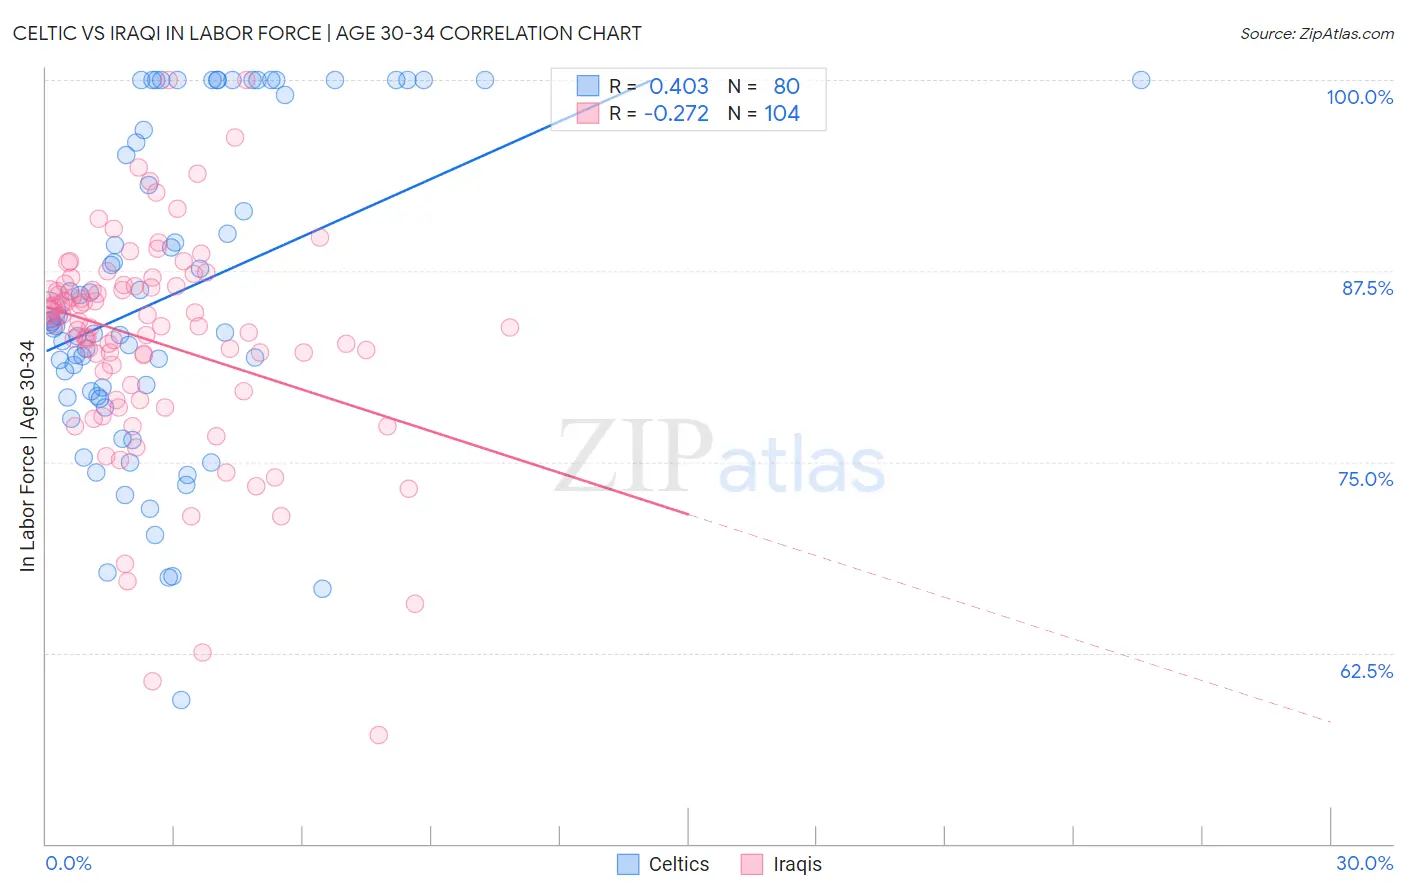
Celtic vs Iraqi In Labor Force | Age 30-34 Correlation Chart
The statistical analysis conducted on geographies consisting of 168,853,097 people shows a moderate positive correlation between the proportion of Celtics and labor force participation rate among population between the ages 30 and 34 in the United States with a correlation coefficient (R) of 0.403 and weighted average of 84.1%. Similarly, the statistical analysis conducted on geographies consisting of 170,642,929 people shows a weak negative correlation between the proportion of Iraqis and labor force participation rate among population between the ages 30 and 34 in the United States with a correlation coefficient (R) of -0.272 and weighted average of 83.8%, a difference of 0.25%.
In Labor Force | Age 30-34 Correlation Summary
| Measurement | Celtic | Iraqi |
| Minimum | 59.4% | 57.1% |
| Maximum | 100.0% | 100.0% |
| Range | 40.6% | 42.9% |
| Mean | 85.9% | 82.9% |
| Median | 84.0% | 84.0% |
| Interquartile 25% (IQ1) | 79.3% | 79.8% |
| Interquartile 75% (IQ3) | 97.8% | 86.5% |
| Interquartile Range (IQR) | 18.6% | 6.7% |
| Standard Deviation (Sample) | 10.4% | 7.2% |
| Standard Deviation (Population) | 10.4% | 7.2% |
Demographics Similar to Celtics and Iraqis by In Labor Force | Age 30-34
In terms of in labor force | age 30-34, the demographic groups most similar to Celtics are Immigrants from Barbados (84.0%, a difference of 0.0%), English (84.0%, a difference of 0.010%), Venezuelan (84.0%, a difference of 0.010%), Immigrants from Portugal (84.0%, a difference of 0.030%), and Immigrants from Oceania (84.0%, a difference of 0.040%). Similarly, the demographic groups most similar to Iraqis are Immigrants from Lebanon (83.9%, a difference of 0.010%), White/Caucasian (83.9%, a difference of 0.060%), Immigrants from St. Vincent and the Grenadines (83.9%, a difference of 0.070%), Immigrants from Nicaragua (83.9%, a difference of 0.090%), and Nicaraguan (83.9%, a difference of 0.10%).
| Demographics | Rating | Rank | In Labor Force | Age 30-34 |
| Celtics | 1.4 /100 | #237 | Tragic 84.1% |
| Immigrants | Barbados | 1.4 /100 | #238 | Tragic 84.0% |
| English | 1.4 /100 | #239 | Tragic 84.0% |
| Venezuelans | 1.3 /100 | #240 | Tragic 84.0% |
| Immigrants | Portugal | 1.2 /100 | #241 | Tragic 84.0% |
| Immigrants | Oceania | 1.1 /100 | #242 | Tragic 84.0% |
| Immigrants | Caribbean | 1.1 /100 | #243 | Tragic 84.0% |
| Basques | 0.9 /100 | #244 | Tragic 84.0% |
| Immigrants | Venezuela | 0.9 /100 | #245 | Tragic 84.0% |
| Central Americans | 0.9 /100 | #246 | Tragic 84.0% |
| British West Indians | 0.8 /100 | #247 | Tragic 84.0% |
| Portuguese | 0.8 /100 | #248 | Tragic 84.0% |
| Immigrants | Dominica | 0.7 /100 | #249 | Tragic 84.0% |
| Immigrants | Iraq | 0.7 /100 | #250 | Tragic 83.9% |
| Nicaraguans | 0.6 /100 | #251 | Tragic 83.9% |
| Bahamians | 0.6 /100 | #252 | Tragic 83.9% |
| Immigrants | Nicaragua | 0.6 /100 | #253 | Tragic 83.9% |
| Immigrants | St. Vincent and the Grenadines | 0.5 /100 | #254 | Tragic 83.9% |
| Whites/Caucasians | 0.5 /100 | #255 | Tragic 83.9% |
| Immigrants | Lebanon | 0.4 /100 | #256 | Tragic 83.9% |
| Iraqis | 0.3 /100 | #257 | Tragic 83.8% |