Venezuelan vs Iraqi Disability Age 65 to 74
COMPARE
Venezuelan
Iraqi
Disability Age 65 to 74
Disability Age 65 to 74 Comparison
Venezuelans
Iraqis
21.8%
DISABILITY AGE 65 TO 74
99.0/ 100
METRIC RATING
79th/ 347
METRIC RANK
24.2%
DISABILITY AGE 65 TO 74
8.1/ 100
METRIC RATING
226th/ 347
METRIC RANK
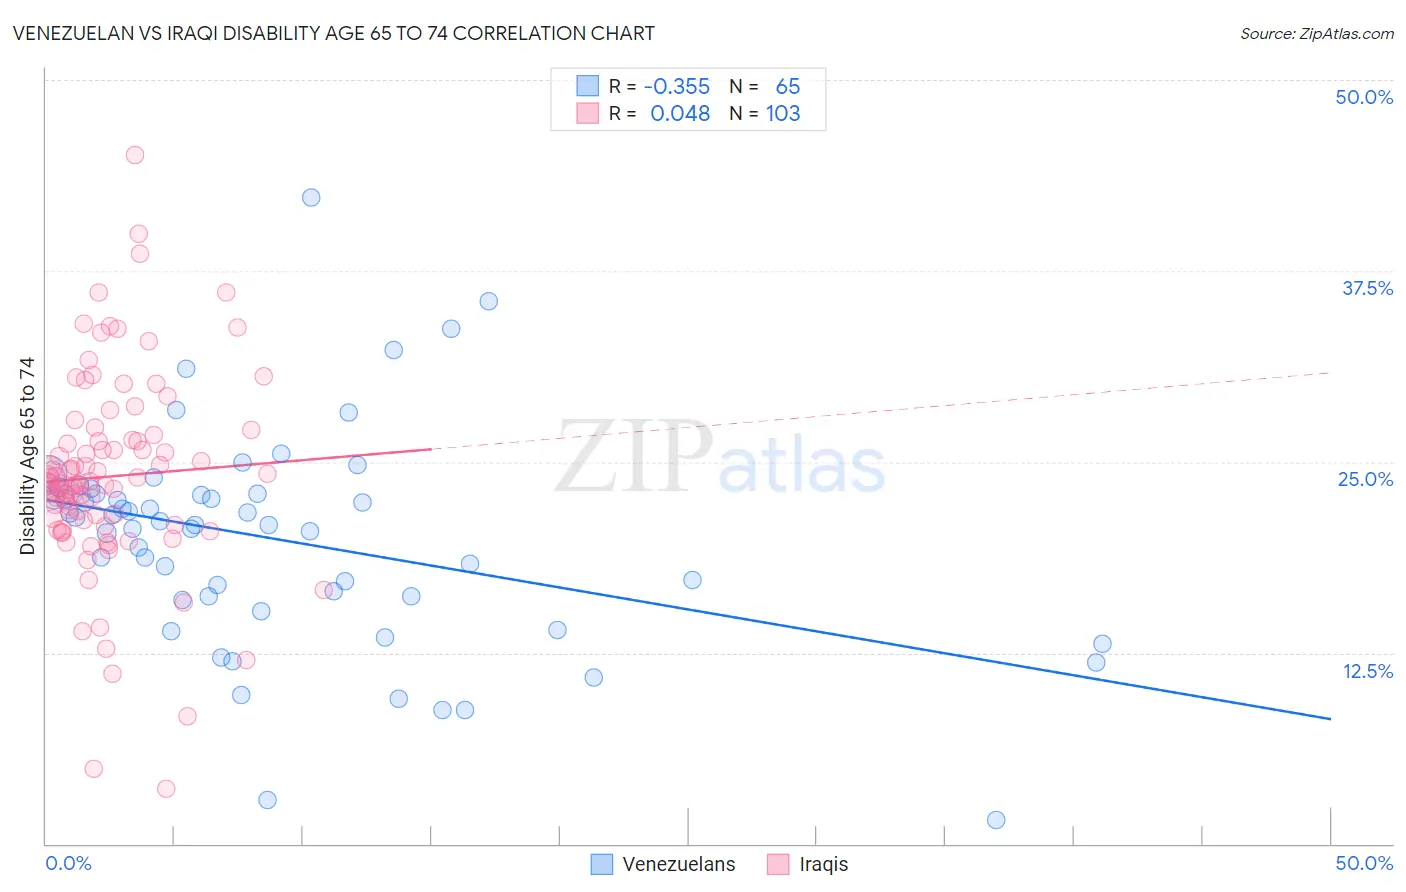
Venezuelan vs Iraqi Disability Age 65 to 74 Correlation Chart
The statistical analysis conducted on geographies consisting of 305,747,321 people shows a mild negative correlation between the proportion of Venezuelans and percentage of population with a disability between the ages 65 and 75 in the United States with a correlation coefficient (R) of -0.355 and weighted average of 21.8%. Similarly, the statistical analysis conducted on geographies consisting of 170,539,860 people shows no correlation between the proportion of Iraqis and percentage of population with a disability between the ages 65 and 75 in the United States with a correlation coefficient (R) of 0.048 and weighted average of 24.2%, a difference of 10.9%.
Disability Age 65 to 74 Correlation Summary
| Measurement | Venezuelan | Iraqi |
| Minimum | 1.6% | 3.6% |
| Maximum | 42.3% | 45.1% |
| Range | 40.7% | 41.5% |
| Mean | 19.9% | 24.0% |
| Median | 20.9% | 23.6% |
| Interquartile 25% (IQ1) | 16.1% | 20.8% |
| Interquartile 75% (IQ3) | 22.9% | 26.5% |
| Interquartile Range (IQR) | 6.9% | 5.6% |
| Standard Deviation (Sample) | 7.1% | 6.5% |
| Standard Deviation (Population) | 7.0% | 6.5% |
Similar Demographics by Disability Age 65 to 74
Demographics Similar to Venezuelans by Disability Age 65 to 74
In terms of disability age 65 to 74, the demographic groups most similar to Venezuelans are Immigrants from Eastern Europe (21.8%, a difference of 0.0%), Immigrants from Norway (21.8%, a difference of 0.010%), Immigrants from Poland (21.8%, a difference of 0.060%), Croatian (21.8%, a difference of 0.080%), and Greek (21.8%, a difference of 0.12%).
| Demographics | Rating | Rank | Disability Age 65 to 74 |
| Immigrants | Hungary | 99.2 /100 | #72 | Exceptional 21.7% |
| Immigrants | Venezuela | 99.0 /100 | #73 | Exceptional 21.8% |
| Cambodians | 99.0 /100 | #74 | Exceptional 21.8% |
| Mongolians | 99.0 /100 | #75 | Exceptional 21.8% |
| Greeks | 99.0 /100 | #76 | Exceptional 21.8% |
| Immigrants | Poland | 99.0 /100 | #77 | Exceptional 21.8% |
| Immigrants | Eastern Europe | 99.0 /100 | #78 | Exceptional 21.8% |
| Venezuelans | 99.0 /100 | #79 | Exceptional 21.8% |
| Immigrants | Norway | 98.9 /100 | #80 | Exceptional 21.8% |
| Croatians | 98.9 /100 | #81 | Exceptional 21.8% |
| Immigrants | Indonesia | 98.7 /100 | #82 | Exceptional 21.9% |
| Immigrants | Brazil | 98.5 /100 | #83 | Exceptional 21.9% |
| Immigrants | Spain | 98.5 /100 | #84 | Exceptional 21.9% |
| Immigrants | Lebanon | 98.4 /100 | #85 | Exceptional 21.9% |
| South Africans | 98.4 /100 | #86 | Exceptional 21.9% |
Demographics Similar to Iraqis by Disability Age 65 to 74
In terms of disability age 65 to 74, the demographic groups most similar to Iraqis are Bermudan (24.2%, a difference of 0.010%), Nigerian (24.2%, a difference of 0.070%), Immigrants from Panama (24.1%, a difference of 0.090%), Immigrants from Middle Africa (24.1%, a difference of 0.14%), and Native Hawaiian (24.1%, a difference of 0.21%).
| Demographics | Rating | Rank | Disability Age 65 to 74 |
| Immigrants | Burma/Myanmar | 11.6 /100 | #219 | Poor 24.0% |
| Ghanaians | 10.4 /100 | #220 | Poor 24.1% |
| Immigrants | Nicaragua | 9.8 /100 | #221 | Tragic 24.1% |
| Native Hawaiians | 9.3 /100 | #222 | Tragic 24.1% |
| Immigrants | Middle Africa | 8.9 /100 | #223 | Tragic 24.1% |
| Immigrants | Panama | 8.6 /100 | #224 | Tragic 24.1% |
| Bermudans | 8.2 /100 | #225 | Tragic 24.2% |
| Iraqis | 8.1 /100 | #226 | Tragic 24.2% |
| Nigerians | 7.8 /100 | #227 | Tragic 24.2% |
| Whites/Caucasians | 6.6 /100 | #228 | Tragic 24.2% |
| Celtics | 6.4 /100 | #229 | Tragic 24.2% |
| Barbadians | 6.0 /100 | #230 | Tragic 24.3% |
| Immigrants | Thailand | 5.2 /100 | #231 | Tragic 24.3% |
| Immigrants | Zaire | 5.0 /100 | #232 | Tragic 24.3% |
| Bahamians | 4.5 /100 | #233 | Tragic 24.4% |