Immigrants from Canada vs Peruvian Hearing Disability
COMPARE
Immigrants from Canada
Peruvian
Hearing Disability
Hearing Disability Comparison
Immigrants from Canada
Peruvians
3.5%
HEARING DISABILITY
0.1/ 100
METRIC RATING
263rd/ 347
METRIC RANK
2.7%
HEARING DISABILITY
97.7/ 100
METRIC RATING
70th/ 347
METRIC RANK
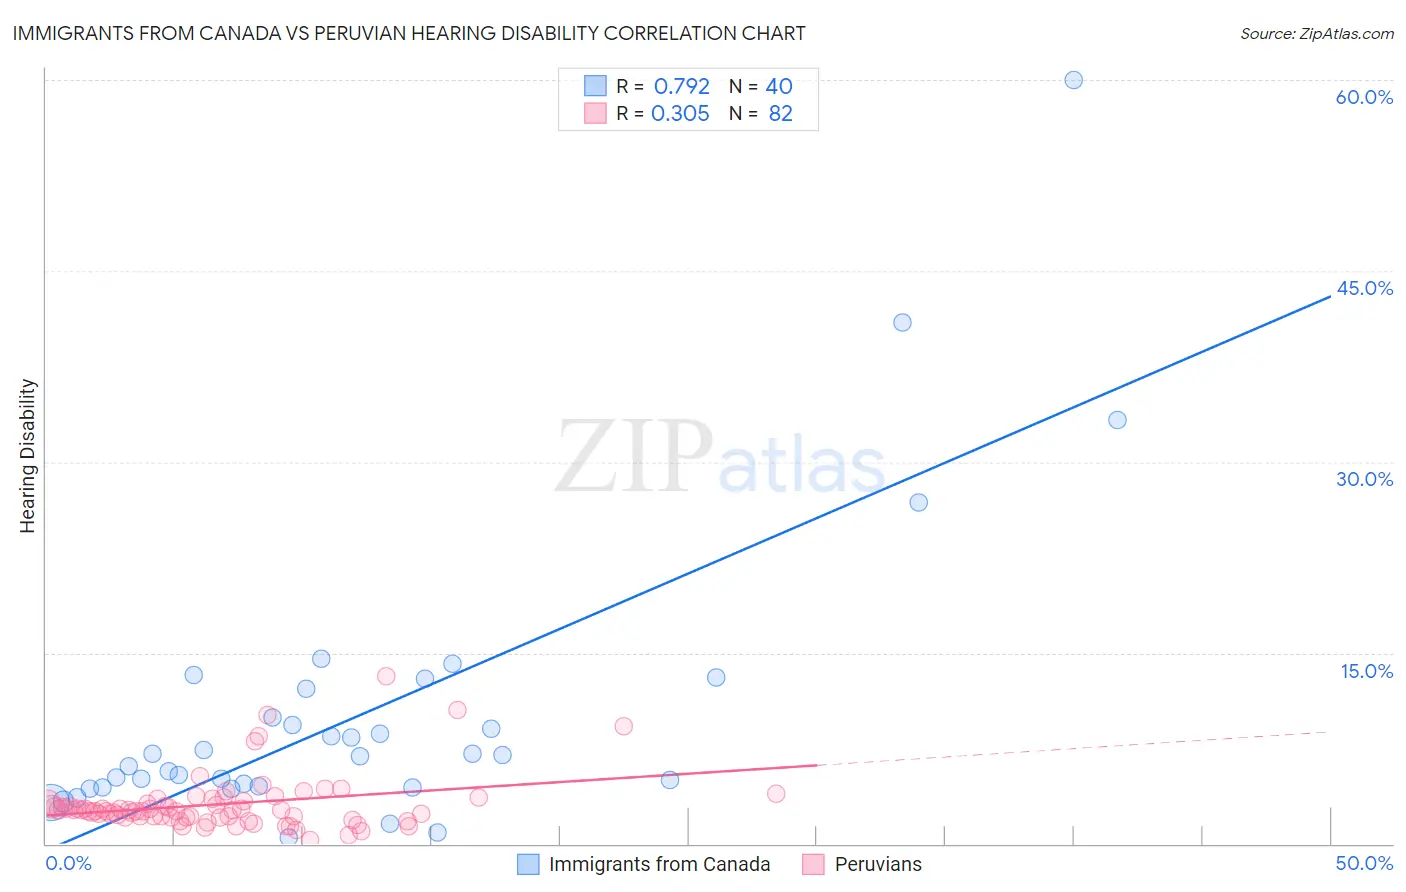
Immigrants from Canada vs Peruvian Hearing Disability Correlation Chart
The statistical analysis conducted on geographies consisting of 459,215,388 people shows a strong positive correlation between the proportion of Immigrants from Canada and percentage of population with hearing disability in the United States with a correlation coefficient (R) of 0.792 and weighted average of 3.5%. Similarly, the statistical analysis conducted on geographies consisting of 363,103,364 people shows a mild positive correlation between the proportion of Peruvians and percentage of population with hearing disability in the United States with a correlation coefficient (R) of 0.305 and weighted average of 2.7%, a difference of 26.9%.
Hearing Disability Correlation Summary
| Measurement | Immigrants from Canada | Peruvian |
| Minimum | 0.49% | 0.31% |
| Maximum | 60.0% | 13.2% |
| Range | 59.5% | 12.9% |
| Mean | 10.2% | 3.1% |
| Median | 7.0% | 2.6% |
| Interquartile 25% (IQ1) | 4.5% | 2.1% |
| Interquartile 75% (IQ3) | 11.0% | 3.2% |
| Interquartile Range (IQR) | 6.6% | 1.2% |
| Standard Deviation (Sample) | 11.5% | 2.2% |
| Standard Deviation (Population) | 11.3% | 2.2% |
Similar Demographics by Hearing Disability
Demographics Similar to Immigrants from Canada by Hearing Disability
In terms of hearing disability, the demographic groups most similar to Immigrants from Canada are Immigrants from North America (3.5%, a difference of 0.040%), Hawaiian (3.5%, a difference of 0.16%), Portuguese (3.5%, a difference of 0.19%), Immigrants from Germany (3.5%, a difference of 0.22%), and British (3.5%, a difference of 0.24%).
| Demographics | Rating | Rank | Hearing Disability |
| Hmong | 0.2 /100 | #256 | Tragic 3.4% |
| Yaqui | 0.2 /100 | #257 | Tragic 3.4% |
| Northern Europeans | 0.2 /100 | #258 | Tragic 3.4% |
| Slovenes | 0.1 /100 | #259 | Tragic 3.5% |
| Portuguese | 0.1 /100 | #260 | Tragic 3.5% |
| Hawaiians | 0.1 /100 | #261 | Tragic 3.5% |
| Immigrants | North America | 0.1 /100 | #262 | Tragic 3.5% |
| Immigrants | Canada | 0.1 /100 | #263 | Tragic 3.5% |
| Immigrants | Germany | 0.1 /100 | #264 | Tragic 3.5% |
| British | 0.1 /100 | #265 | Tragic 3.5% |
| Belgians | 0.1 /100 | #266 | Tragic 3.5% |
| Canadians | 0.1 /100 | #267 | Tragic 3.5% |
| Spaniards | 0.1 /100 | #268 | Tragic 3.5% |
| Ute | 0.1 /100 | #269 | Tragic 3.5% |
| Europeans | 0.1 /100 | #270 | Tragic 3.5% |
Demographics Similar to Peruvians by Hearing Disability
In terms of hearing disability, the demographic groups most similar to Peruvians are Central American (2.7%, a difference of 0.050%), Afghan (2.7%, a difference of 0.15%), Nicaraguan (2.7%, a difference of 0.23%), Argentinean (2.7%, a difference of 0.23%), and Immigrants from Korea (2.7%, a difference of 0.23%).
| Demographics | Rating | Rank | Hearing Disability |
| Indians (Asian) | 98.4 /100 | #63 | Exceptional 2.7% |
| Immigrants | Sri Lanka | 98.4 /100 | #64 | Exceptional 2.7% |
| Immigrants | Nepal | 98.3 /100 | #65 | Exceptional 2.7% |
| Immigrants | Belize | 98.2 /100 | #66 | Exceptional 2.7% |
| Egyptians | 98.1 /100 | #67 | Exceptional 2.7% |
| Immigrants | Africa | 98.0 /100 | #68 | Exceptional 2.7% |
| Nicaraguans | 97.9 /100 | #69 | Exceptional 2.7% |
| Peruvians | 97.7 /100 | #70 | Exceptional 2.7% |
| Central Americans | 97.7 /100 | #71 | Exceptional 2.7% |
| Afghans | 97.6 /100 | #72 | Exceptional 2.7% |
| Argentineans | 97.5 /100 | #73 | Exceptional 2.7% |
| Immigrants | Korea | 97.5 /100 | #74 | Exceptional 2.7% |
| Immigrants | Saudi Arabia | 97.5 /100 | #75 | Exceptional 2.7% |
| Asians | 97.5 /100 | #76 | Exceptional 2.7% |
| Immigrants | Malaysia | 97.5 /100 | #77 | Exceptional 2.7% |