Carpatho Rusyn vs Immigrants from Liberia Female Disability
COMPARE
Carpatho Rusyn
Immigrants from Liberia
Female Disability
Female Disability Comparison
Carpatho Rusyns
Immigrants from Liberia
12.6%
FEMALE DISABILITY
2.0/ 100
METRIC RATING
248th/ 347
METRIC RANK
12.9%
FEMALE DISABILITY
0.3/ 100
METRIC RATING
270th/ 347
METRIC RANK
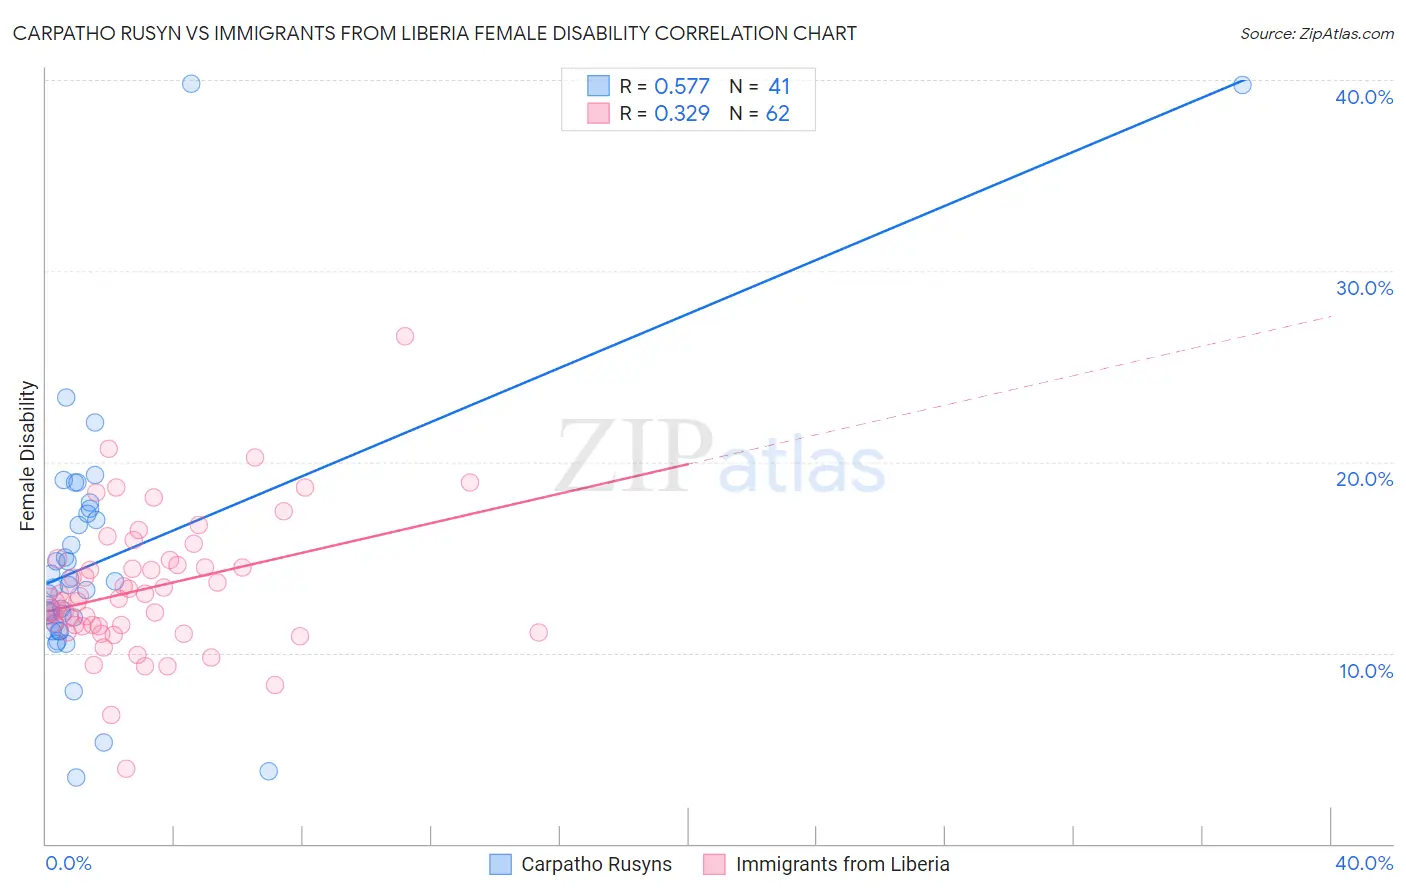
Carpatho Rusyn vs Immigrants from Liberia Female Disability Correlation Chart
The statistical analysis conducted on geographies consisting of 58,872,330 people shows a substantial positive correlation between the proportion of Carpatho Rusyns and percentage of females with a disability in the United States with a correlation coefficient (R) of 0.577 and weighted average of 12.6%. Similarly, the statistical analysis conducted on geographies consisting of 135,259,122 people shows a mild positive correlation between the proportion of Immigrants from Liberia and percentage of females with a disability in the United States with a correlation coefficient (R) of 0.329 and weighted average of 12.9%, a difference of 1.7%.
Female Disability Correlation Summary
| Measurement | Carpatho Rusyn | Immigrants from Liberia |
| Minimum | 3.5% | 3.9% |
| Maximum | 39.8% | 26.5% |
| Range | 36.3% | 22.6% |
| Mean | 14.9% | 13.4% |
| Median | 13.6% | 12.9% |
| Interquartile 25% (IQ1) | 11.3% | 11.4% |
| Interquartile 75% (IQ3) | 17.4% | 14.9% |
| Interquartile Range (IQR) | 6.1% | 3.5% |
| Standard Deviation (Sample) | 7.1% | 3.6% |
| Standard Deviation (Population) | 7.0% | 3.6% |
Similar Demographics by Female Disability
Demographics Similar to Carpatho Rusyns by Female Disability
In terms of female disability, the demographic groups most similar to Carpatho Rusyns are Menominee (12.6%, a difference of 0.040%), Spanish American Indian (12.6%, a difference of 0.050%), Immigrants from Jamaica (12.6%, a difference of 0.070%), Immigrants from Congo (12.7%, a difference of 0.13%), and Slovene (12.7%, a difference of 0.17%).
| Demographics | Rating | Rank | Female Disability |
| Japanese | 2.7 /100 | #241 | Tragic 12.6% |
| Canadians | 2.6 /100 | #242 | Tragic 12.6% |
| Immigrants | Senegal | 2.5 /100 | #243 | Tragic 12.6% |
| Alsatians | 2.5 /100 | #244 | Tragic 12.6% |
| Immigrants | Jamaica | 2.2 /100 | #245 | Tragic 12.6% |
| Spanish American Indians | 2.1 /100 | #246 | Tragic 12.6% |
| Menominee | 2.1 /100 | #247 | Tragic 12.6% |
| Carpatho Rusyns | 2.0 /100 | #248 | Tragic 12.6% |
| Immigrants | Congo | 1.8 /100 | #249 | Tragic 12.7% |
| Slovenes | 1.7 /100 | #250 | Tragic 12.7% |
| Crow | 1.6 /100 | #251 | Tragic 12.7% |
| Immigrants | Caribbean | 1.4 /100 | #252 | Tragic 12.7% |
| Jamaicans | 1.4 /100 | #253 | Tragic 12.7% |
| Hawaiians | 1.4 /100 | #254 | Tragic 12.7% |
| Immigrants | Germany | 1.3 /100 | #255 | Tragic 12.7% |
Demographics Similar to Immigrants from Liberia by Female Disability
In terms of female disability, the demographic groups most similar to Immigrants from Liberia are Indonesian (12.8%, a difference of 0.18%), Immigrants from Laos (12.8%, a difference of 0.24%), Senegalese (12.8%, a difference of 0.27%), Finnish (12.8%, a difference of 0.28%), and West Indian (12.8%, a difference of 0.40%).
| Demographics | Rating | Rank | Female Disability |
| Spaniards | 0.7 /100 | #263 | Tragic 12.8% |
| Alaska Natives | 0.6 /100 | #264 | Tragic 12.8% |
| West Indians | 0.5 /100 | #265 | Tragic 12.8% |
| Finns | 0.4 /100 | #266 | Tragic 12.8% |
| Senegalese | 0.4 /100 | #267 | Tragic 12.8% |
| Immigrants | Laos | 0.4 /100 | #268 | Tragic 12.8% |
| Indonesians | 0.4 /100 | #269 | Tragic 12.8% |
| Immigrants | Liberia | 0.3 /100 | #270 | Tragic 12.9% |
| Dutch | 0.2 /100 | #271 | Tragic 12.9% |
| Germans | 0.1 /100 | #272 | Tragic 12.9% |
| Sioux | 0.1 /100 | #273 | Tragic 12.9% |
| Portuguese | 0.1 /100 | #274 | Tragic 13.0% |
| Cheyenne | 0.1 /100 | #275 | Tragic 13.0% |
| Immigrants | Dominica | 0.1 /100 | #276 | Tragic 13.0% |
| Spanish | 0.1 /100 | #277 | Tragic 13.0% |