Thai vs Immigrants from Liberia Female Disability
COMPARE
Thai
Immigrants from Liberia
Female Disability
Female Disability Comparison
Thais
Immigrants from Liberia
10.2%
FEMALE DISABILITY
100.0/ 100
METRIC RATING
4th/ 347
METRIC RANK
12.9%
FEMALE DISABILITY
0.3/ 100
METRIC RATING
270th/ 347
METRIC RANK
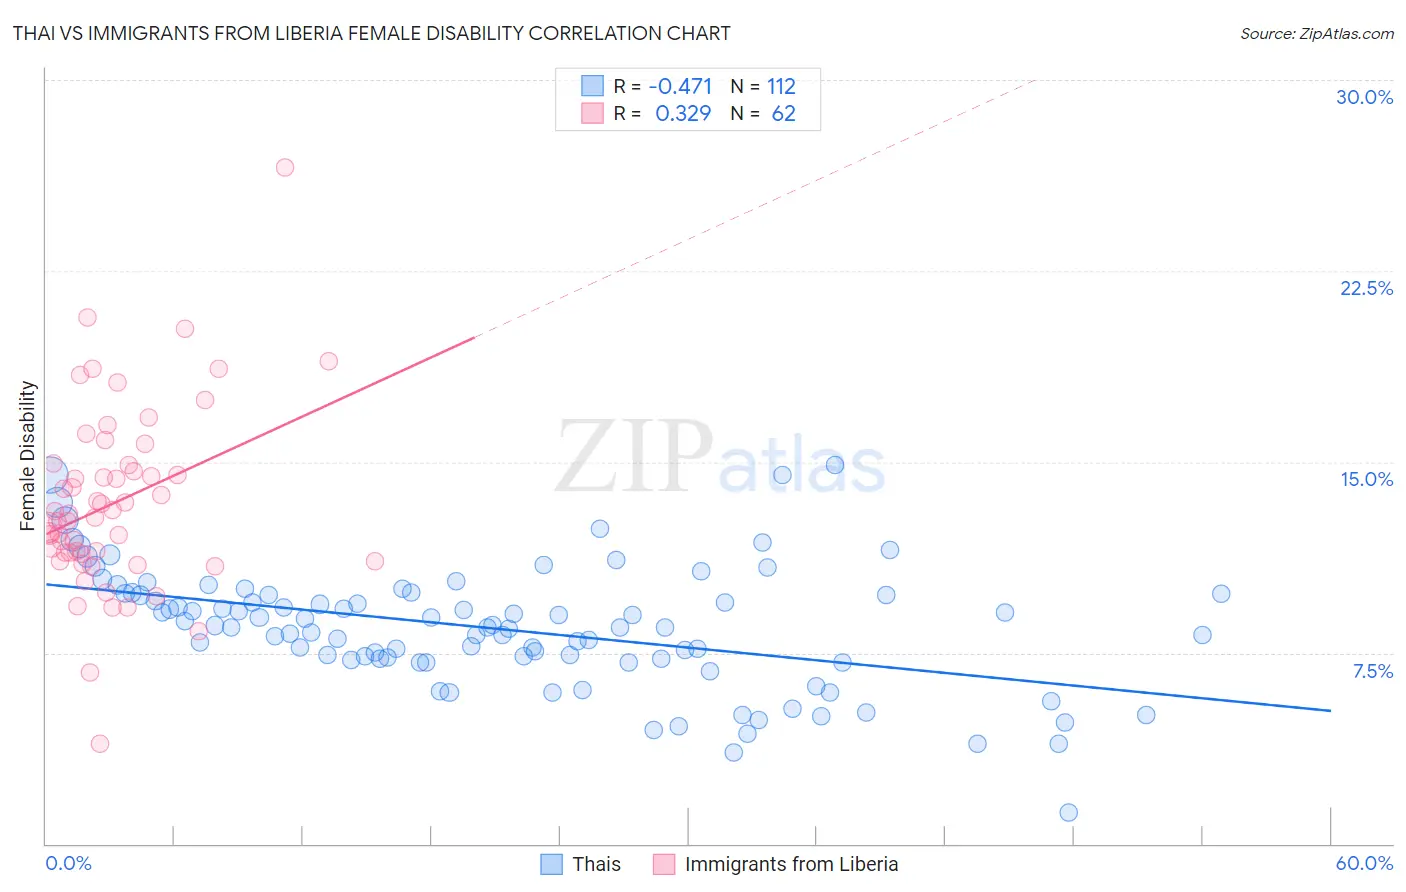
Thai vs Immigrants from Liberia Female Disability Correlation Chart
The statistical analysis conducted on geographies consisting of 475,795,002 people shows a moderate negative correlation between the proportion of Thais and percentage of females with a disability in the United States with a correlation coefficient (R) of -0.471 and weighted average of 10.2%. Similarly, the statistical analysis conducted on geographies consisting of 135,259,122 people shows a mild positive correlation between the proportion of Immigrants from Liberia and percentage of females with a disability in the United States with a correlation coefficient (R) of 0.329 and weighted average of 12.9%, a difference of 26.3%.
Female Disability Correlation Summary
| Measurement | Thai | Immigrants from Liberia |
| Minimum | 1.2% | 3.9% |
| Maximum | 14.9% | 26.5% |
| Range | 13.7% | 22.6% |
| Mean | 8.5% | 13.4% |
| Median | 8.5% | 12.9% |
| Interquartile 25% (IQ1) | 7.3% | 11.4% |
| Interquartile 75% (IQ3) | 9.8% | 14.9% |
| Interquartile Range (IQR) | 2.5% | 3.5% |
| Standard Deviation (Sample) | 2.4% | 3.6% |
| Standard Deviation (Population) | 2.4% | 3.6% |
Similar Demographics by Female Disability
Demographics Similar to Thais by Female Disability
In terms of female disability, the demographic groups most similar to Thais are Immigrants from Bolivia (10.3%, a difference of 0.82%), Immigrants from Taiwan (10.1%, a difference of 0.88%), Filipino (10.1%, a difference of 1.1%), Bolivian (10.4%, a difference of 1.7%), and Immigrants from India (10.0%, a difference of 2.1%).
| Demographics | Rating | Rank | Female Disability |
| Immigrants | India | 100.0 /100 | #1 | Exceptional 10.0% |
| Filipinos | 100.0 /100 | #2 | Exceptional 10.1% |
| Immigrants | Taiwan | 100.0 /100 | #3 | Exceptional 10.1% |
| Thais | 100.0 /100 | #4 | Exceptional 10.2% |
| Immigrants | Bolivia | 100.0 /100 | #5 | Exceptional 10.3% |
| Bolivians | 100.0 /100 | #6 | Exceptional 10.4% |
| Immigrants | Singapore | 100.0 /100 | #7 | Exceptional 10.4% |
| Immigrants | South Central Asia | 100.0 /100 | #8 | Exceptional 10.5% |
| Iranians | 100.0 /100 | #9 | Exceptional 10.6% |
| Immigrants | Hong Kong | 100.0 /100 | #10 | Exceptional 10.6% |
| Immigrants | Korea | 100.0 /100 | #11 | Exceptional 10.6% |
| Immigrants | Israel | 100.0 /100 | #12 | Exceptional 10.7% |
| Immigrants | Eastern Asia | 100.0 /100 | #13 | Exceptional 10.7% |
| Immigrants | China | 100.0 /100 | #14 | Exceptional 10.7% |
| Burmese | 100.0 /100 | #15 | Exceptional 10.7% |
Demographics Similar to Immigrants from Liberia by Female Disability
In terms of female disability, the demographic groups most similar to Immigrants from Liberia are Indonesian (12.8%, a difference of 0.18%), Immigrants from Laos (12.8%, a difference of 0.24%), Senegalese (12.8%, a difference of 0.27%), Finnish (12.8%, a difference of 0.28%), and West Indian (12.8%, a difference of 0.40%).
| Demographics | Rating | Rank | Female Disability |
| Spaniards | 0.7 /100 | #263 | Tragic 12.8% |
| Alaska Natives | 0.6 /100 | #264 | Tragic 12.8% |
| West Indians | 0.5 /100 | #265 | Tragic 12.8% |
| Finns | 0.4 /100 | #266 | Tragic 12.8% |
| Senegalese | 0.4 /100 | #267 | Tragic 12.8% |
| Immigrants | Laos | 0.4 /100 | #268 | Tragic 12.8% |
| Indonesians | 0.4 /100 | #269 | Tragic 12.8% |
| Immigrants | Liberia | 0.3 /100 | #270 | Tragic 12.9% |
| Dutch | 0.2 /100 | #271 | Tragic 12.9% |
| Germans | 0.1 /100 | #272 | Tragic 12.9% |
| Sioux | 0.1 /100 | #273 | Tragic 12.9% |
| Portuguese | 0.1 /100 | #274 | Tragic 13.0% |
| Cheyenne | 0.1 /100 | #275 | Tragic 13.0% |
| Immigrants | Dominica | 0.1 /100 | #276 | Tragic 13.0% |
| Spanish | 0.1 /100 | #277 | Tragic 13.0% |