Carpatho Rusyn vs Immigrants from South Africa Female Disability
COMPARE
Carpatho Rusyn
Immigrants from South Africa
Female Disability
Female Disability Comparison
Carpatho Rusyns
Immigrants from South Africa
12.6%
FEMALE DISABILITY
2.0/ 100
METRIC RATING
248th/ 347
METRIC RANK
11.5%
FEMALE DISABILITY
99.7/ 100
METRIC RATING
78th/ 347
METRIC RANK
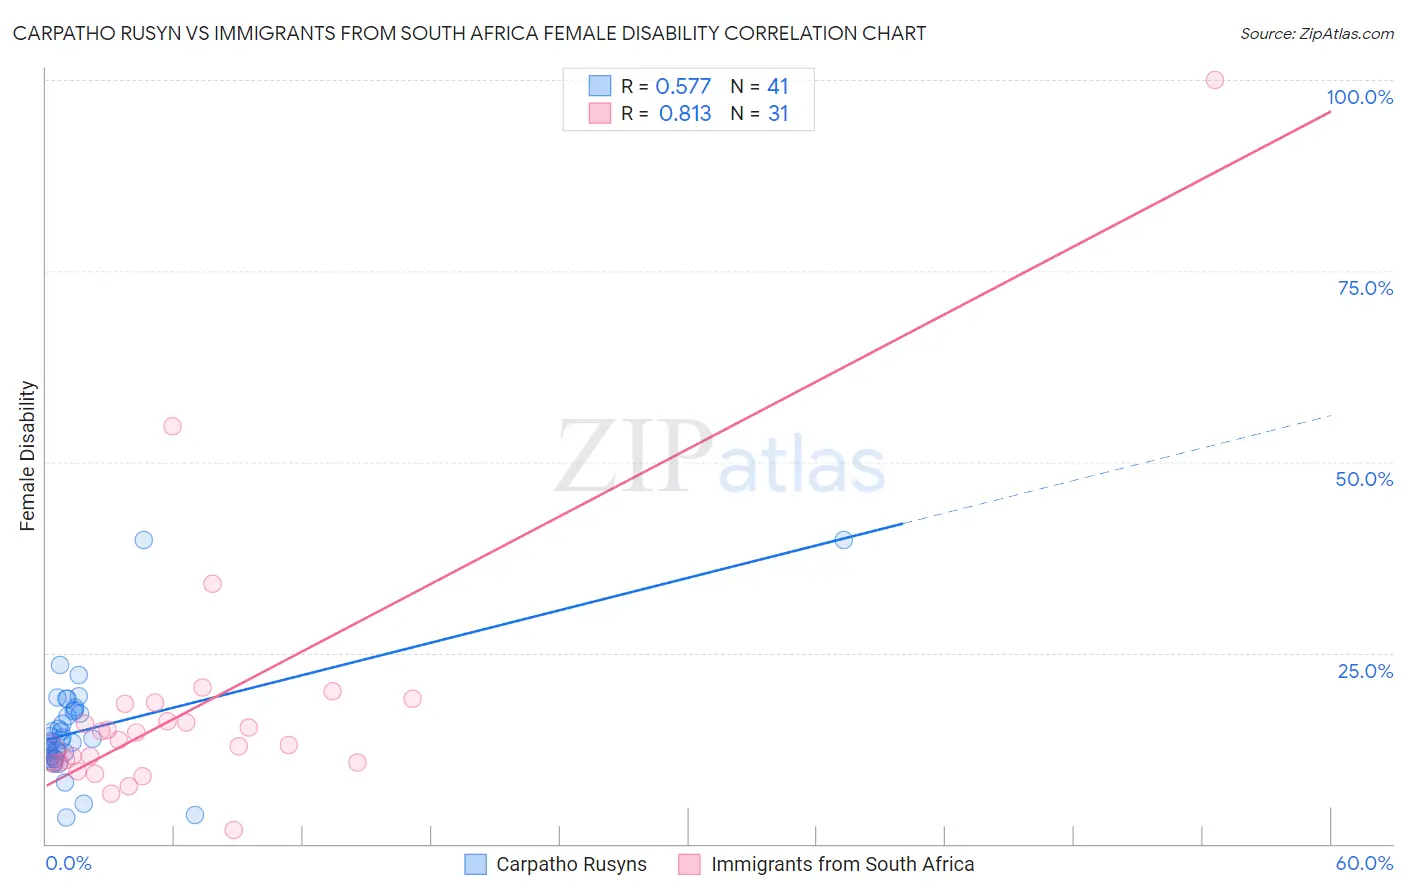
Carpatho Rusyn vs Immigrants from South Africa Female Disability Correlation Chart
The statistical analysis conducted on geographies consisting of 58,872,330 people shows a substantial positive correlation between the proportion of Carpatho Rusyns and percentage of females with a disability in the United States with a correlation coefficient (R) of 0.577 and weighted average of 12.6%. Similarly, the statistical analysis conducted on geographies consisting of 233,307,950 people shows a very strong positive correlation between the proportion of Immigrants from South Africa and percentage of females with a disability in the United States with a correlation coefficient (R) of 0.813 and weighted average of 11.5%, a difference of 9.8%.
Female Disability Correlation Summary
| Measurement | Carpatho Rusyn | Immigrants from South Africa |
| Minimum | 3.5% | 1.8% |
| Maximum | 39.8% | 100.0% |
| Range | 36.3% | 98.2% |
| Mean | 14.9% | 17.8% |
| Median | 13.6% | 13.6% |
| Interquartile 25% (IQ1) | 11.3% | 10.6% |
| Interquartile 75% (IQ3) | 17.4% | 18.3% |
| Interquartile Range (IQR) | 6.1% | 7.7% |
| Standard Deviation (Sample) | 7.1% | 17.8% |
| Standard Deviation (Population) | 7.0% | 17.5% |
Similar Demographics by Female Disability
Demographics Similar to Carpatho Rusyns by Female Disability
In terms of female disability, the demographic groups most similar to Carpatho Rusyns are Menominee (12.6%, a difference of 0.040%), Spanish American Indian (12.6%, a difference of 0.050%), Immigrants from Jamaica (12.6%, a difference of 0.070%), Immigrants from Congo (12.7%, a difference of 0.13%), and Slovene (12.7%, a difference of 0.17%).
| Demographics | Rating | Rank | Female Disability |
| Japanese | 2.7 /100 | #241 | Tragic 12.6% |
| Canadians | 2.6 /100 | #242 | Tragic 12.6% |
| Immigrants | Senegal | 2.5 /100 | #243 | Tragic 12.6% |
| Alsatians | 2.5 /100 | #244 | Tragic 12.6% |
| Immigrants | Jamaica | 2.2 /100 | #245 | Tragic 12.6% |
| Spanish American Indians | 2.1 /100 | #246 | Tragic 12.6% |
| Menominee | 2.1 /100 | #247 | Tragic 12.6% |
| Carpatho Rusyns | 2.0 /100 | #248 | Tragic 12.6% |
| Immigrants | Congo | 1.8 /100 | #249 | Tragic 12.7% |
| Slovenes | 1.7 /100 | #250 | Tragic 12.7% |
| Crow | 1.6 /100 | #251 | Tragic 12.7% |
| Immigrants | Caribbean | 1.4 /100 | #252 | Tragic 12.7% |
| Jamaicans | 1.4 /100 | #253 | Tragic 12.7% |
| Hawaiians | 1.4 /100 | #254 | Tragic 12.7% |
| Immigrants | Germany | 1.3 /100 | #255 | Tragic 12.7% |
Demographics Similar to Immigrants from South Africa by Female Disability
In terms of female disability, the demographic groups most similar to Immigrants from South Africa are Immigrants from Eritrea (11.5%, a difference of 0.010%), Immigrants from Afghanistan (11.5%, a difference of 0.010%), Sierra Leonean (11.5%, a difference of 0.020%), Immigrants from Jordan (11.5%, a difference of 0.030%), and Immigrants from Lebanon (11.5%, a difference of 0.040%).
| Demographics | Rating | Rank | Female Disability |
| Immigrants | Ireland | 99.8 /100 | #71 | Exceptional 11.5% |
| Chileans | 99.8 /100 | #72 | Exceptional 11.5% |
| Immigrants | Switzerland | 99.8 /100 | #73 | Exceptional 11.5% |
| Bhutanese | 99.8 /100 | #74 | Exceptional 11.5% |
| Immigrants | Lebanon | 99.7 /100 | #75 | Exceptional 11.5% |
| Immigrants | Eritrea | 99.7 /100 | #76 | Exceptional 11.5% |
| Immigrants | Afghanistan | 99.7 /100 | #77 | Exceptional 11.5% |
| Immigrants | South Africa | 99.7 /100 | #78 | Exceptional 11.5% |
| Sierra Leoneans | 99.7 /100 | #79 | Exceptional 11.5% |
| Immigrants | Jordan | 99.7 /100 | #80 | Exceptional 11.5% |
| Eastern Europeans | 99.7 /100 | #81 | Exceptional 11.5% |
| Luxembourgers | 99.6 /100 | #82 | Exceptional 11.6% |
| Immigrants | Serbia | 99.6 /100 | #83 | Exceptional 11.6% |
| Immigrants | Poland | 99.6 /100 | #84 | Exceptional 11.6% |
| Palestinians | 99.6 /100 | #85 | Exceptional 11.6% |