Cape Verdean vs Aleut No Vehicles in Household
COMPARE
Cape Verdean
Aleut
No Vehicles in Household
No Vehicles in Household Comparison
Cape Verdeans
Aleuts
15.6%
NO VEHICLES IN HOUSEHOLD
0.0/ 100
METRIC RATING
310th/ 347
METRIC RANK
13.0%
NO VEHICLES IN HOUSEHOLD
0.1/ 100
METRIC RATING
277th/ 347
METRIC RANK
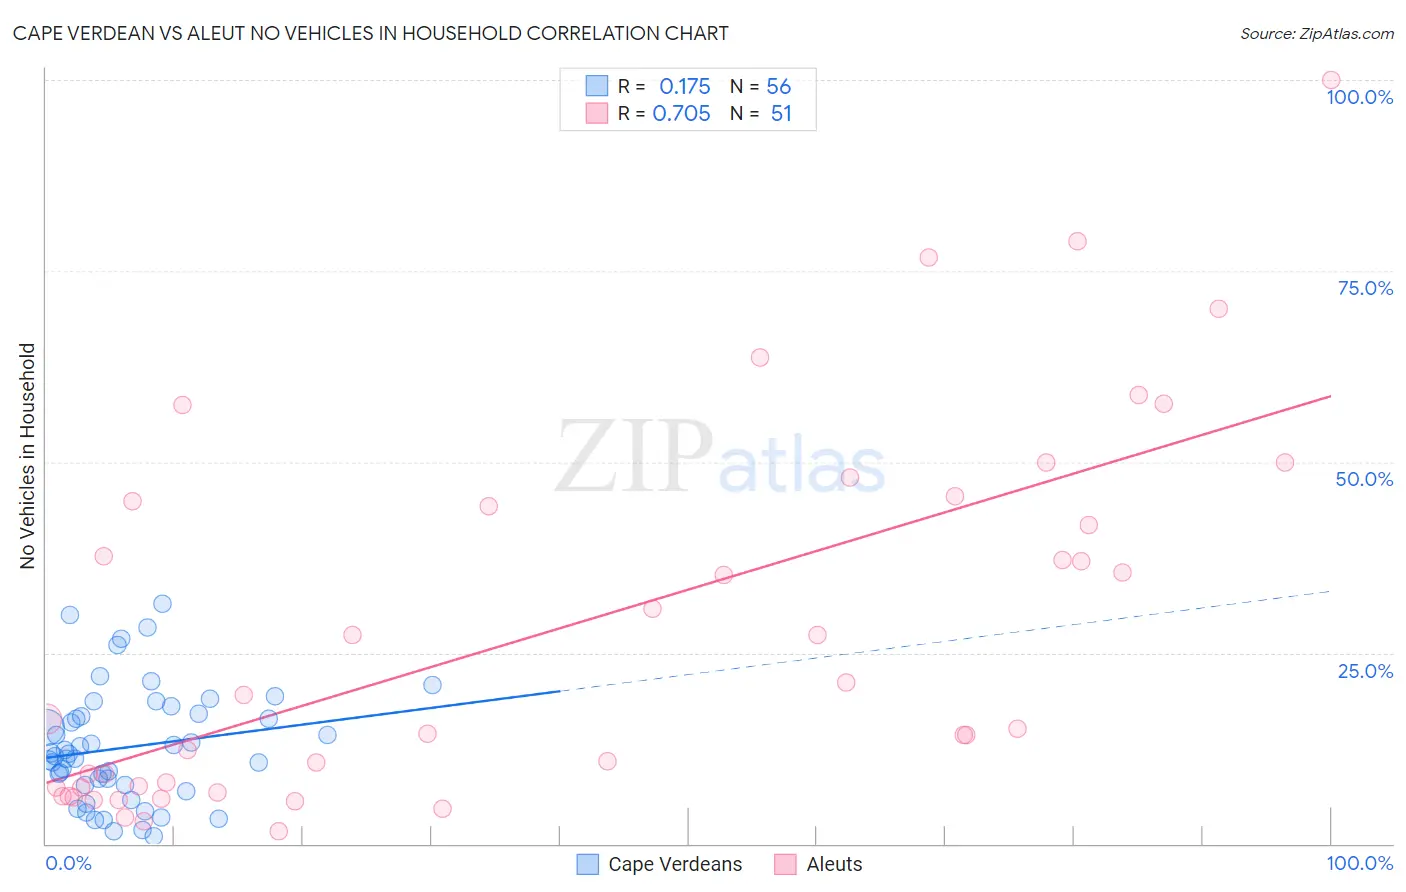
Cape Verdean vs Aleut No Vehicles in Household Correlation Chart
The statistical analysis conducted on geographies consisting of 107,427,210 people shows a poor positive correlation between the proportion of Cape Verdeans and percentage of households with no vehicle available in the United States with a correlation coefficient (R) of 0.175 and weighted average of 15.6%. Similarly, the statistical analysis conducted on geographies consisting of 61,729,503 people shows a strong positive correlation between the proportion of Aleuts and percentage of households with no vehicle available in the United States with a correlation coefficient (R) of 0.705 and weighted average of 13.0%, a difference of 19.5%.
No Vehicles in Household Correlation Summary
| Measurement | Cape Verdean | Aleut |
| Minimum | 1.0% | 1.7% |
| Maximum | 31.5% | 100.0% |
| Range | 30.4% | 98.3% |
| Mean | 12.6% | 27.7% |
| Median | 11.6% | 16.4% |
| Interquartile 25% (IQ1) | 7.6% | 7.3% |
| Interquartile 75% (IQ3) | 16.9% | 44.8% |
| Interquartile Range (IQR) | 9.2% | 37.5% |
| Standard Deviation (Sample) | 7.4% | 24.2% |
| Standard Deviation (Population) | 7.3% | 23.9% |
Similar Demographics by No Vehicles in Household
Demographics Similar to Cape Verdeans by No Vehicles in Household
In terms of no vehicles in household, the demographic groups most similar to Cape Verdeans are Immigrants from Israel (15.6%, a difference of 0.010%), Alaskan Athabascan (15.6%, a difference of 0.16%), Tohono O'odham (15.6%, a difference of 0.31%), Albanian (15.6%, a difference of 0.48%), and Puerto Rican (15.5%, a difference of 0.56%).
| Demographics | Rating | Rank | No Vehicles in Household |
| Immigrants | Western Africa | 0.0 /100 | #303 | Tragic 15.0% |
| Immigrants | Russia | 0.0 /100 | #304 | Tragic 15.1% |
| Immigrants | China | 0.0 /100 | #305 | Tragic 15.2% |
| Immigrants | Belize | 0.0 /100 | #306 | Tragic 15.4% |
| Immigrants | Haiti | 0.0 /100 | #307 | Tragic 15.4% |
| U.S. Virgin Islanders | 0.0 /100 | #308 | Tragic 15.4% |
| Puerto Ricans | 0.0 /100 | #309 | Tragic 15.5% |
| Cape Verdeans | 0.0 /100 | #310 | Tragic 15.6% |
| Immigrants | Israel | 0.0 /100 | #311 | Tragic 15.6% |
| Alaskan Athabascans | 0.0 /100 | #312 | Tragic 15.6% |
| Tohono O'odham | 0.0 /100 | #313 | Tragic 15.6% |
| Albanians | 0.0 /100 | #314 | Tragic 15.6% |
| Cypriots | 0.0 /100 | #315 | Tragic 15.7% |
| Ghanaians | 0.0 /100 | #316 | Tragic 16.4% |
| Immigrants | Ghana | 0.0 /100 | #317 | Tragic 16.6% |
Demographics Similar to Aleuts by No Vehicles in Household
In terms of no vehicles in household, the demographic groups most similar to Aleuts are Immigrants from Croatia (13.0%, a difference of 0.040%), Immigrants from Southern Europe (13.0%, a difference of 0.080%), Immigrants from Albania (13.0%, a difference of 0.44%), Immigrants from Singapore (12.9%, a difference of 0.62%), and Immigrants from France (12.9%, a difference of 0.66%).
| Demographics | Rating | Rank | No Vehicles in Household |
| Immigrants | Northern Africa | 0.2 /100 | #270 | Tragic 12.6% |
| Immigrants | Morocco | 0.2 /100 | #271 | Tragic 12.6% |
| Bermudans | 0.1 /100 | #272 | Tragic 12.8% |
| Immigrants | France | 0.1 /100 | #273 | Tragic 12.9% |
| Immigrants | Singapore | 0.1 /100 | #274 | Tragic 12.9% |
| Immigrants | Albania | 0.1 /100 | #275 | Tragic 13.0% |
| Immigrants | Southern Europe | 0.1 /100 | #276 | Tragic 13.0% |
| Aleuts | 0.1 /100 | #277 | Tragic 13.0% |
| Immigrants | Croatia | 0.1 /100 | #278 | Tragic 13.0% |
| Mongolians | 0.0 /100 | #279 | Tragic 13.1% |
| Alsatians | 0.0 /100 | #280 | Tragic 13.2% |
| Central American Indians | 0.0 /100 | #281 | Tragic 13.3% |
| Immigrants | Eastern Asia | 0.0 /100 | #282 | Tragic 13.5% |
| Immigrants | Kazakhstan | 0.0 /100 | #283 | Tragic 13.6% |
| Immigrants | Malaysia | 0.0 /100 | #284 | Tragic 13.6% |