Cape Verdean vs Aleut Single Father Poverty
COMPARE
Cape Verdean
Aleut
Single Father Poverty
Single Father Poverty Comparison
Cape Verdeans
Aleuts
16.5%
SINGLE FATHER POVERTY
24.4/ 100
METRIC RATING
194th/ 347
METRIC RANK
16.4%
SINGLE FATHER POVERTY
35.3/ 100
METRIC RATING
183rd/ 347
METRIC RANK
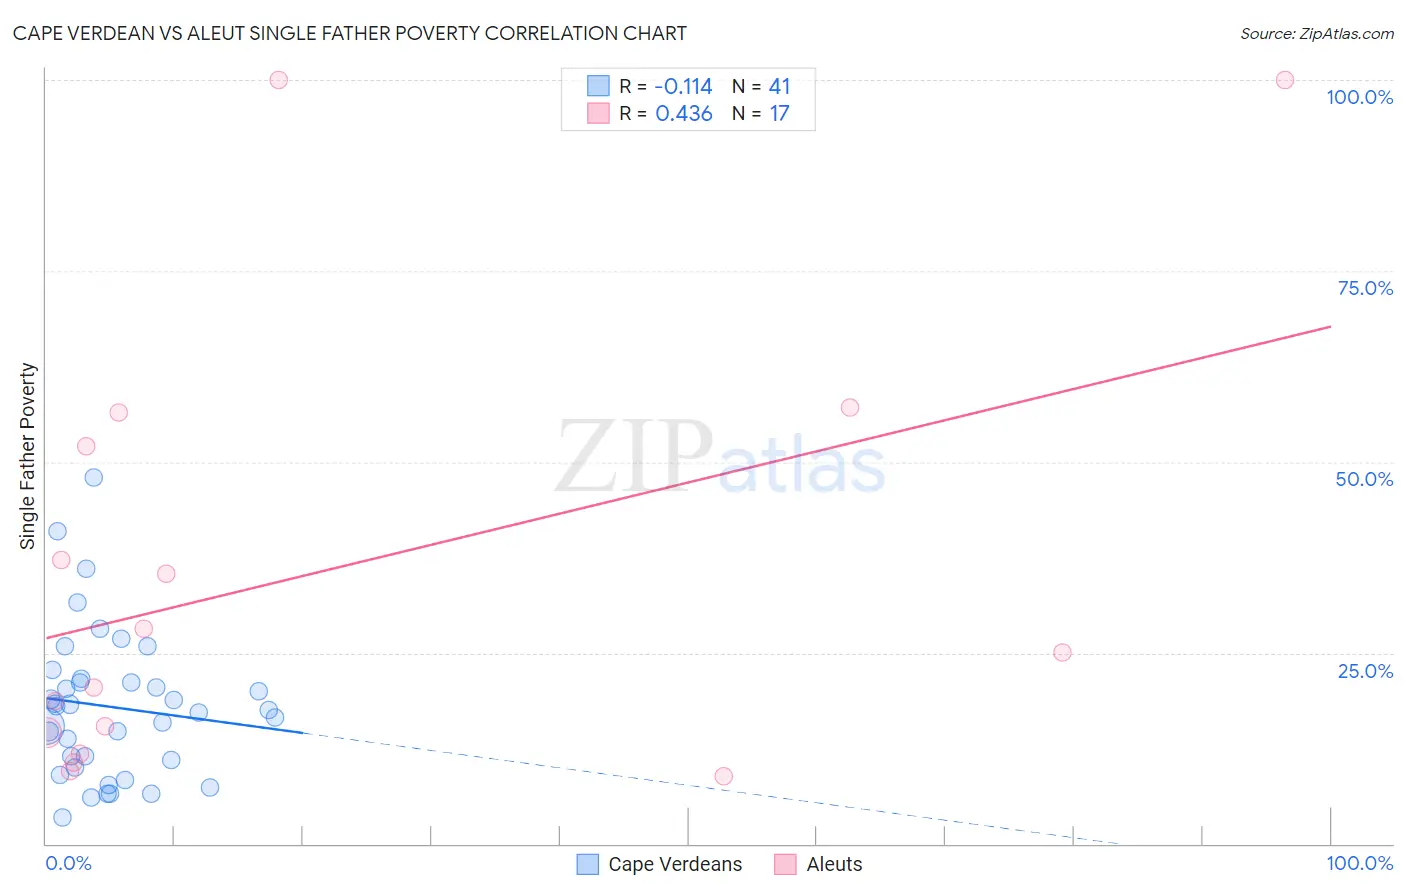
Cape Verdean vs Aleut Single Father Poverty Correlation Chart
The statistical analysis conducted on geographies consisting of 96,813,617 people shows a poor negative correlation between the proportion of Cape Verdeans and poverty level among single fathers in the United States with a correlation coefficient (R) of -0.114 and weighted average of 16.5%. Similarly, the statistical analysis conducted on geographies consisting of 56,707,511 people shows a moderate positive correlation between the proportion of Aleuts and poverty level among single fathers in the United States with a correlation coefficient (R) of 0.436 and weighted average of 16.4%, a difference of 0.58%.
Single Father Poverty Correlation Summary
| Measurement | Cape Verdean | Aleut |
| Minimum | 3.5% | 8.8% |
| Maximum | 47.9% | 100.0% |
| Range | 44.4% | 91.2% |
| Mean | 17.9% | 35.4% |
| Median | 17.4% | 25.0% |
| Interquartile 25% (IQ1) | 10.4% | 13.1% |
| Interquartile 75% (IQ3) | 21.3% | 54.3% |
| Interquartile Range (IQR) | 10.9% | 41.1% |
| Standard Deviation (Sample) | 9.6% | 29.1% |
| Standard Deviation (Population) | 9.5% | 28.3% |
Demographics Similar to Cape Verdeans and Aleuts by Single Father Poverty
In terms of single father poverty, the demographic groups most similar to Cape Verdeans are Immigrants from Barbados (16.5%, a difference of 0.0%), Ecuadorian (16.5%, a difference of 0.010%), Immigrants from Switzerland (16.5%, a difference of 0.020%), Immigrants from Canada (16.5%, a difference of 0.15%), and Immigrants from Guyana (16.5%, a difference of 0.16%). Similarly, the demographic groups most similar to Aleuts are Immigrants from Italy (16.4%, a difference of 0.020%), Immigrants from Western Africa (16.4%, a difference of 0.030%), Cambodian (16.4%, a difference of 0.030%), Panamanian (16.4%, a difference of 0.080%), and Immigrants from Latin America (16.4%, a difference of 0.090%).
| Demographics | Rating | Rank | Single Father Poverty |
| Immigrants | Cuba | 41.6 /100 | #178 | Average 16.4% |
| Serbians | 40.9 /100 | #179 | Average 16.4% |
| Immigrants | Latin America | 37.2 /100 | #180 | Fair 16.4% |
| Immigrants | Western Africa | 36.0 /100 | #181 | Fair 16.4% |
| Immigrants | Italy | 35.7 /100 | #182 | Fair 16.4% |
| Aleuts | 35.3 /100 | #183 | Fair 16.4% |
| Cambodians | 34.6 /100 | #184 | Fair 16.4% |
| Panamanians | 33.6 /100 | #185 | Fair 16.4% |
| Immigrants | Venezuela | 31.0 /100 | #186 | Fair 16.4% |
| Ukrainians | 30.4 /100 | #187 | Fair 16.4% |
| Russians | 30.1 /100 | #188 | Fair 16.4% |
| Latvians | 28.9 /100 | #189 | Fair 16.5% |
| Immigrants | Burma/Myanmar | 28.0 /100 | #190 | Fair 16.5% |
| Immigrants | Guyana | 27.1 /100 | #191 | Fair 16.5% |
| Immigrants | Switzerland | 24.8 /100 | #192 | Fair 16.5% |
| Ecuadorians | 24.5 /100 | #193 | Fair 16.5% |
| Cape Verdeans | 24.4 /100 | #194 | Fair 16.5% |
| Immigrants | Barbados | 24.3 /100 | #195 | Fair 16.5% |
| Immigrants | Canada | 21.9 /100 | #196 | Fair 16.5% |
| Immigrants | Northern Europe | 20.3 /100 | #197 | Fair 16.5% |
| Romanians | 20.1 /100 | #198 | Fair 16.5% |