Cajun vs Immigrants from Northern Africa Hearing Disability
COMPARE
Cajun
Immigrants from Northern Africa
Hearing Disability
Hearing Disability Comparison
Cajuns
Immigrants from Northern Africa
3.9%
HEARING DISABILITY
0.0/ 100
METRIC RATING
312th/ 347
METRIC RANK
2.8%
HEARING DISABILITY
96.9/ 100
METRIC RATING
85th/ 347
METRIC RANK
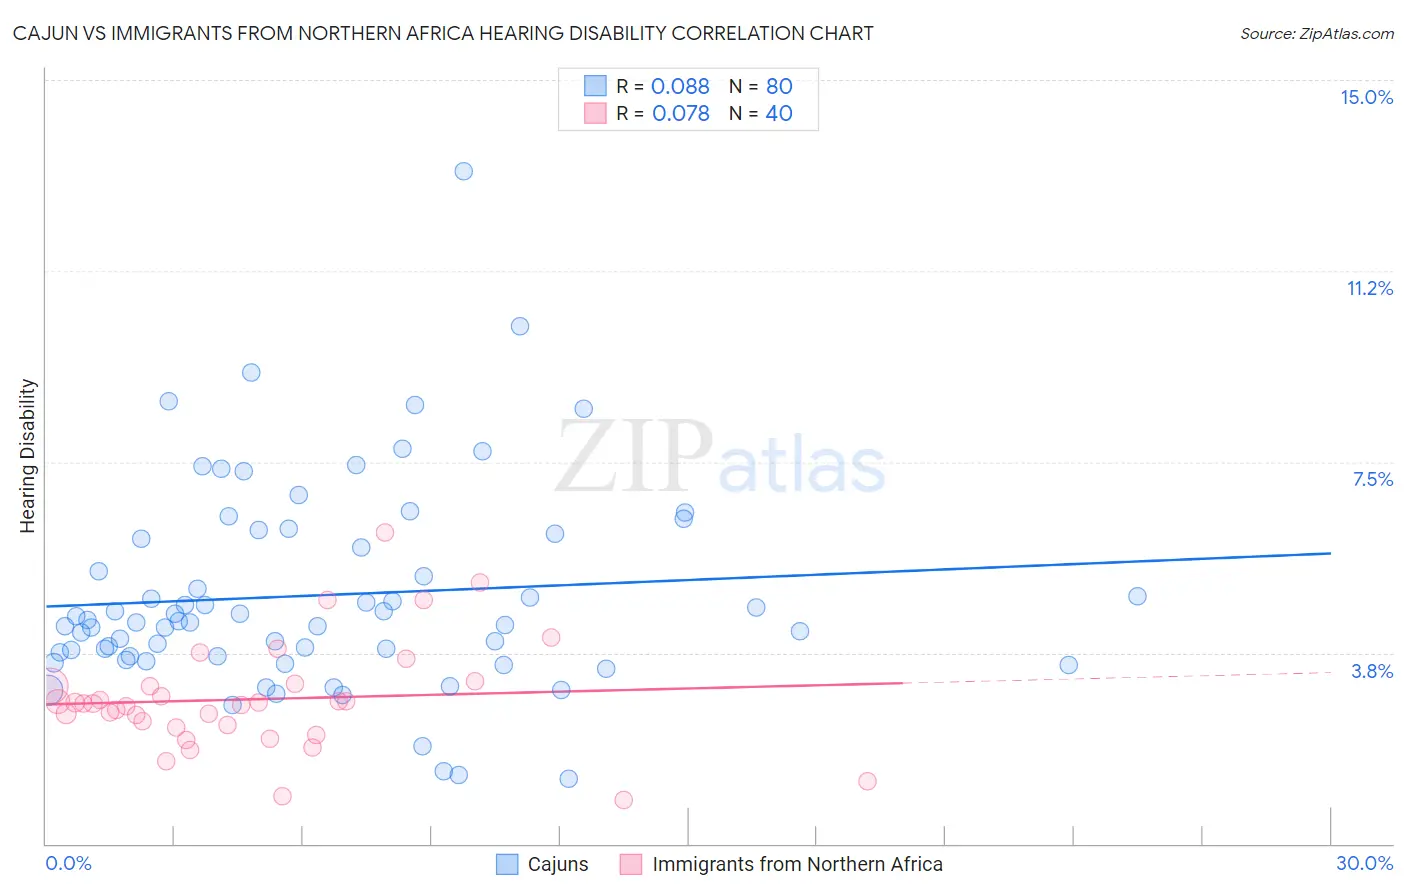
Cajun vs Immigrants from Northern Africa Hearing Disability Correlation Chart
The statistical analysis conducted on geographies consisting of 149,694,482 people shows a slight positive correlation between the proportion of Cajuns and percentage of population with hearing disability in the United States with a correlation coefficient (R) of 0.088 and weighted average of 3.9%. Similarly, the statistical analysis conducted on geographies consisting of 321,108,850 people shows a slight positive correlation between the proportion of Immigrants from Northern Africa and percentage of population with hearing disability in the United States with a correlation coefficient (R) of 0.078 and weighted average of 2.8%, a difference of 43.0%.
Hearing Disability Correlation Summary
| Measurement | Cajun | Immigrants from Northern Africa |
| Minimum | 1.3% | 0.86% |
| Maximum | 13.2% | 6.1% |
| Range | 11.9% | 5.3% |
| Mean | 4.9% | 2.8% |
| Median | 4.4% | 2.8% |
| Interquartile 25% (IQ1) | 3.7% | 2.3% |
| Interquartile 75% (IQ3) | 6.0% | 3.1% |
| Interquartile Range (IQR) | 2.4% | 0.81% |
| Standard Deviation (Sample) | 2.0% | 1.1% |
| Standard Deviation (Population) | 2.0% | 1.1% |
Similar Demographics by Hearing Disability
Demographics Similar to Cajuns by Hearing Disability
In terms of hearing disability, the demographic groups most similar to Cajuns are Hopi (3.9%, a difference of 0.11%), Yakama (3.9%, a difference of 0.28%), Puget Sound Salish (3.9%, a difference of 0.29%), Spanish American (4.0%, a difference of 0.49%), and Comanche (4.0%, a difference of 0.62%).
| Demographics | Rating | Rank | Hearing Disability |
| English | 0.0 /100 | #305 | Tragic 3.8% |
| Marshallese | 0.0 /100 | #306 | Tragic 3.8% |
| French Canadians | 0.0 /100 | #307 | Tragic 3.8% |
| Ottawa | 0.0 /100 | #308 | Tragic 3.8% |
| Scotch-Irish | 0.0 /100 | #309 | Tragic 3.8% |
| Cree | 0.0 /100 | #310 | Tragic 3.8% |
| Americans | 0.0 /100 | #311 | Tragic 3.9% |
| Cajuns | 0.0 /100 | #312 | Tragic 3.9% |
| Hopi | 0.0 /100 | #313 | Tragic 3.9% |
| Yakama | 0.0 /100 | #314 | Tragic 3.9% |
| Puget Sound Salish | 0.0 /100 | #315 | Tragic 3.9% |
| Spanish Americans | 0.0 /100 | #316 | Tragic 4.0% |
| Comanche | 0.0 /100 | #317 | Tragic 4.0% |
| Cheyenne | 0.0 /100 | #318 | Tragic 4.0% |
| Chippewa | 0.0 /100 | #319 | Tragic 4.0% |
Demographics Similar to Immigrants from Northern Africa by Hearing Disability
In terms of hearing disability, the demographic groups most similar to Immigrants from Northern Africa are Immigrants from Iran (2.8%, a difference of 0.020%), Immigrants from Argentina (2.8%, a difference of 0.070%), Somali (2.8%, a difference of 0.13%), Immigrants from Turkey (2.8%, a difference of 0.17%), and Belizean (2.8%, a difference of 0.20%).
| Demographics | Rating | Rank | Hearing Disability |
| Mongolians | 97.4 /100 | #78 | Exceptional 2.7% |
| Colombians | 97.4 /100 | #79 | Exceptional 2.7% |
| Immigrants | Asia | 97.2 /100 | #80 | Exceptional 2.7% |
| Immigrants | Uruguay | 97.2 /100 | #81 | Exceptional 2.7% |
| Immigrants | Armenia | 97.2 /100 | #82 | Exceptional 2.7% |
| Immigrants | Cuba | 97.2 /100 | #83 | Exceptional 2.7% |
| Immigrants | Argentina | 97.0 /100 | #84 | Exceptional 2.8% |
| Immigrants | Northern Africa | 96.9 /100 | #85 | Exceptional 2.8% |
| Immigrants | Iran | 96.8 /100 | #86 | Exceptional 2.8% |
| Somalis | 96.7 /100 | #87 | Exceptional 2.8% |
| Immigrants | Turkey | 96.7 /100 | #88 | Exceptional 2.8% |
| Belizeans | 96.6 /100 | #89 | Exceptional 2.8% |
| Immigrants | Morocco | 96.6 /100 | #90 | Exceptional 2.8% |
| Immigrants | Middle Africa | 96.5 /100 | #91 | Exceptional 2.8% |
| Iranians | 96.4 /100 | #92 | Exceptional 2.8% |