Cajun vs Immigrants from Netherlands 9th Grade
COMPARE
Cajun
Immigrants from Netherlands
9th Grade
9th Grade Comparison
Cajuns
Immigrants from Netherlands
95.1%
9TH GRADE
77.3/ 100
METRIC RATING
151st/ 347
METRIC RANK
95.8%
9TH GRADE
99.6/ 100
METRIC RATING
66th/ 347
METRIC RANK
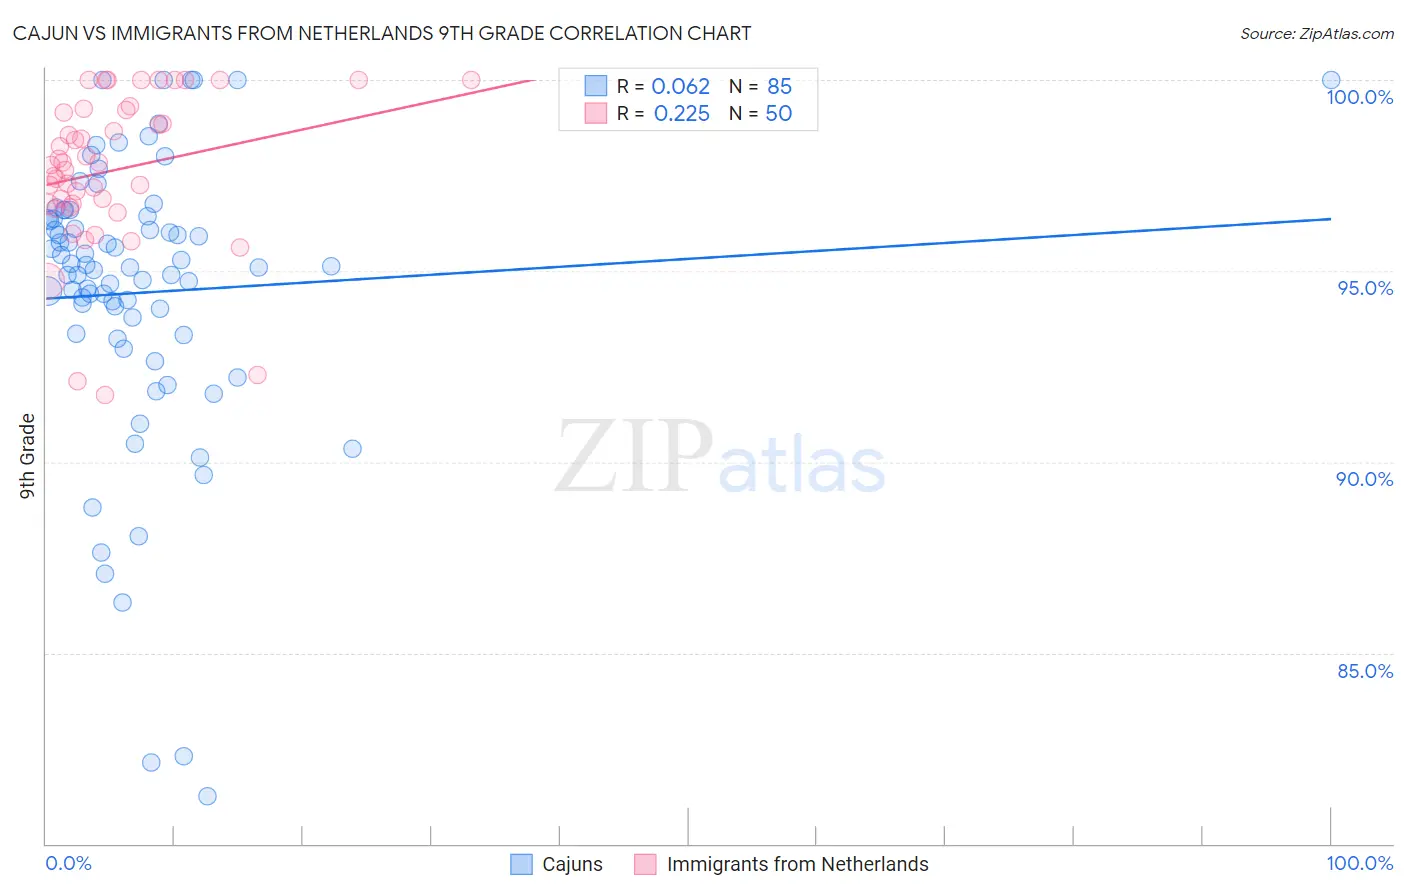
Cajun vs Immigrants from Netherlands 9th Grade Correlation Chart
The statistical analysis conducted on geographies consisting of 149,711,516 people shows a slight positive correlation between the proportion of Cajuns and percentage of population with at least 9th grade education in the United States with a correlation coefficient (R) of 0.062 and weighted average of 95.1%. Similarly, the statistical analysis conducted on geographies consisting of 237,869,934 people shows a weak positive correlation between the proportion of Immigrants from Netherlands and percentage of population with at least 9th grade education in the United States with a correlation coefficient (R) of 0.225 and weighted average of 95.8%, a difference of 0.79%.
9th Grade Correlation Summary
| Measurement | Cajun | Immigrants from Netherlands |
| Minimum | 81.2% | 91.8% |
| Maximum | 100.0% | 100.0% |
| Range | 18.8% | 8.2% |
| Mean | 94.4% | 97.6% |
| Median | 95.1% | 97.8% |
| Interquartile 25% (IQ1) | 93.3% | 96.7% |
| Interquartile 75% (IQ3) | 96.4% | 99.2% |
| Interquartile Range (IQR) | 3.1% | 2.5% |
| Standard Deviation (Sample) | 3.8% | 2.0% |
| Standard Deviation (Population) | 3.8% | 2.0% |
Similar Demographics by 9th Grade
Demographics Similar to Cajuns by 9th Grade
In terms of 9th grade, the demographic groups most similar to Cajuns are Ugandan (95.1%, a difference of 0.0%), Albanian (95.1%, a difference of 0.010%), Immigrants from Korea (95.1%, a difference of 0.020%), Kenyan (95.1%, a difference of 0.020%), and Arab (95.1%, a difference of 0.030%).
| Demographics | Rating | Rank | 9th Grade |
| Yup'ik | 83.3 /100 | #144 | Excellent 95.2% |
| Pueblo | 82.2 /100 | #145 | Excellent 95.1% |
| Immigrants | Sri Lanka | 82.1 /100 | #146 | Excellent 95.1% |
| Choctaw | 81.9 /100 | #147 | Excellent 95.1% |
| Immigrants | Jordan | 81.2 /100 | #148 | Excellent 95.1% |
| Immigrants | Korea | 79.6 /100 | #149 | Good 95.1% |
| Kenyans | 79.1 /100 | #150 | Good 95.1% |
| Cajuns | 77.3 /100 | #151 | Good 95.1% |
| Ugandans | 77.0 /100 | #152 | Good 95.1% |
| Albanians | 76.1 /100 | #153 | Good 95.1% |
| Arabs | 74.9 /100 | #154 | Good 95.1% |
| Immigrants | Kazakhstan | 74.7 /100 | #155 | Good 95.1% |
| Immigrants | Kenya | 73.1 /100 | #156 | Good 95.0% |
| Mongolians | 73.0 /100 | #157 | Good 95.0% |
| Egyptians | 70.1 /100 | #158 | Good 95.0% |
Demographics Similar to Immigrants from Netherlands by 9th Grade
In terms of 9th grade, the demographic groups most similar to Immigrants from Netherlands are Cypriot (95.8%, a difference of 0.010%), Immigrants from Ireland (95.8%, a difference of 0.010%), Immigrants from Lithuania (95.8%, a difference of 0.010%), Immigrants from England (95.9%, a difference of 0.020%), and Zimbabwean (95.9%, a difference of 0.030%).
| Demographics | Rating | Rank | 9th Grade |
| New Zealanders | 99.8 /100 | #59 | Exceptional 95.9% |
| Native Hawaiians | 99.8 /100 | #60 | Exceptional 95.9% |
| Sioux | 99.8 /100 | #61 | Exceptional 95.9% |
| Ukrainians | 99.7 /100 | #62 | Exceptional 95.9% |
| Canadians | 99.7 /100 | #63 | Exceptional 95.9% |
| Zimbabweans | 99.7 /100 | #64 | Exceptional 95.9% |
| Immigrants | England | 99.6 /100 | #65 | Exceptional 95.9% |
| Immigrants | Netherlands | 99.6 /100 | #66 | Exceptional 95.8% |
| Cypriots | 99.6 /100 | #67 | Exceptional 95.8% |
| Immigrants | Ireland | 99.6 /100 | #68 | Exceptional 95.8% |
| Immigrants | Lithuania | 99.6 /100 | #69 | Exceptional 95.8% |
| Immigrants | Australia | 99.5 /100 | #70 | Exceptional 95.8% |
| Immigrants | Belgium | 99.5 /100 | #71 | Exceptional 95.8% |
| Turks | 99.5 /100 | #72 | Exceptional 95.8% |
| Immigrants | Singapore | 99.5 /100 | #73 | Exceptional 95.8% |