Bulgarian vs Osage Male Disability
COMPARE
Bulgarian
Osage
Male Disability
Male Disability Comparison
Bulgarians
Osage
10.6%
MALE DISABILITY
98.1/ 100
METRIC RATING
84th/ 347
METRIC RANK
14.0%
MALE DISABILITY
0.0/ 100
METRIC RATING
323rd/ 347
METRIC RANK
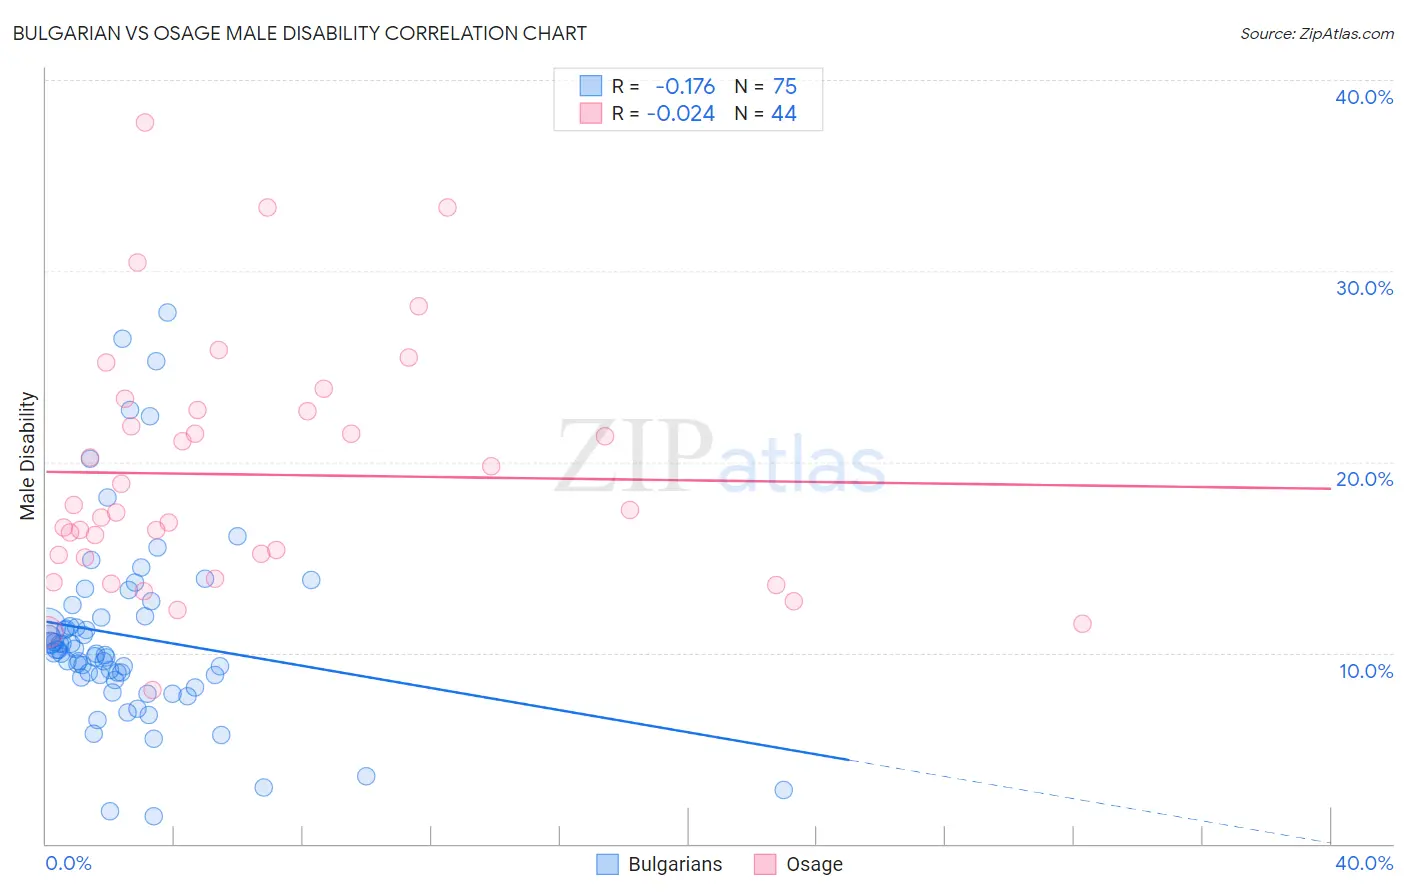
Bulgarian vs Osage Male Disability Correlation Chart
The statistical analysis conducted on geographies consisting of 205,628,995 people shows a poor negative correlation between the proportion of Bulgarians and percentage of males with a disability in the United States with a correlation coefficient (R) of -0.176 and weighted average of 10.6%. Similarly, the statistical analysis conducted on geographies consisting of 91,798,879 people shows no correlation between the proportion of Osage and percentage of males with a disability in the United States with a correlation coefficient (R) of -0.024 and weighted average of 14.0%, a difference of 32.2%.
Male Disability Correlation Summary
| Measurement | Bulgarian | Osage |
| Minimum | 1.5% | 8.0% |
| Maximum | 27.8% | 37.7% |
| Range | 26.4% | 29.7% |
| Mean | 10.9% | 19.3% |
| Median | 10.0% | 17.4% |
| Interquartile 25% (IQ1) | 8.7% | 15.1% |
| Interquartile 75% (IQ3) | 11.9% | 22.7% |
| Interquartile Range (IQR) | 3.2% | 7.6% |
| Standard Deviation (Sample) | 5.0% | 6.4% |
| Standard Deviation (Population) | 5.0% | 6.4% |
Similar Demographics by Male Disability
Demographics Similar to Bulgarians by Male Disability
In terms of male disability, the demographic groups most similar to Bulgarians are Immigrants from Poland (10.6%, a difference of 0.010%), Immigrants from Guyana (10.6%, a difference of 0.080%), Immigrants from Chile (10.6%, a difference of 0.14%), Sri Lankan (10.6%, a difference of 0.18%), and Immigrants from Ireland (10.6%, a difference of 0.18%).
| Demographics | Rating | Rank | Male Disability |
| Laotians | 98.6 /100 | #77 | Exceptional 10.6% |
| Immigrants | Russia | 98.6 /100 | #78 | Exceptional 10.6% |
| Zimbabweans | 98.4 /100 | #79 | Exceptional 10.6% |
| Immigrants | Jordan | 98.4 /100 | #80 | Exceptional 10.6% |
| Immigrants | Chile | 98.3 /100 | #81 | Exceptional 10.6% |
| Immigrants | Guyana | 98.2 /100 | #82 | Exceptional 10.6% |
| Immigrants | Poland | 98.1 /100 | #83 | Exceptional 10.6% |
| Bulgarians | 98.1 /100 | #84 | Exceptional 10.6% |
| Sri Lankans | 97.9 /100 | #85 | Exceptional 10.6% |
| Immigrants | Ireland | 97.9 /100 | #86 | Exceptional 10.6% |
| Immigrants | Vietnam | 97.9 /100 | #87 | Exceptional 10.6% |
| Immigrants | Western Asia | 97.8 /100 | #88 | Exceptional 10.6% |
| Immigrants | Nicaragua | 97.8 /100 | #89 | Exceptional 10.6% |
| Immigrants | Morocco | 97.7 /100 | #90 | Exceptional 10.6% |
| Immigrants | France | 97.6 /100 | #91 | Exceptional 10.6% |
Demographics Similar to Osage by Male Disability
In terms of male disability, the demographic groups most similar to Osage are Apache (14.0%, a difference of 0.070%), Comanche (14.1%, a difference of 0.33%), Ottawa (14.1%, a difference of 0.44%), Shoshone (13.8%, a difference of 1.2%), and Tlingit-Haida (13.8%, a difference of 1.3%).
| Demographics | Rating | Rank | Male Disability |
| Alaska Natives | 0.0 /100 | #316 | Tragic 13.6% |
| Paiute | 0.0 /100 | #317 | Tragic 13.7% |
| Cree | 0.0 /100 | #318 | Tragic 13.7% |
| Americans | 0.0 /100 | #319 | Tragic 13.8% |
| Tlingit-Haida | 0.0 /100 | #320 | Tragic 13.8% |
| Shoshone | 0.0 /100 | #321 | Tragic 13.8% |
| Apache | 0.0 /100 | #322 | Tragic 14.0% |
| Osage | 0.0 /100 | #323 | Tragic 14.0% |
| Comanche | 0.0 /100 | #324 | Tragic 14.1% |
| Ottawa | 0.0 /100 | #325 | Tragic 14.1% |
| Natives/Alaskans | 0.0 /100 | #326 | Tragic 14.2% |
| Potawatomi | 0.0 /100 | #327 | Tragic 14.2% |
| Chippewa | 0.0 /100 | #328 | Tragic 14.3% |
| Cajuns | 0.0 /100 | #329 | Tragic 14.4% |
| Navajo | 0.0 /100 | #330 | Tragic 14.4% |