Brazilian vs Immigrants from Nicaragua Median Earnings
COMPARE
Brazilian
Immigrants from Nicaragua
Median Earnings
Median Earnings Comparison
Brazilians
Immigrants from Nicaragua
$48,356
MEDIAN EARNINGS
93.7/ 100
METRIC RATING
124th/ 347
METRIC RANK
$41,737
MEDIAN EARNINGS
0.1/ 100
METRIC RATING
285th/ 347
METRIC RANK
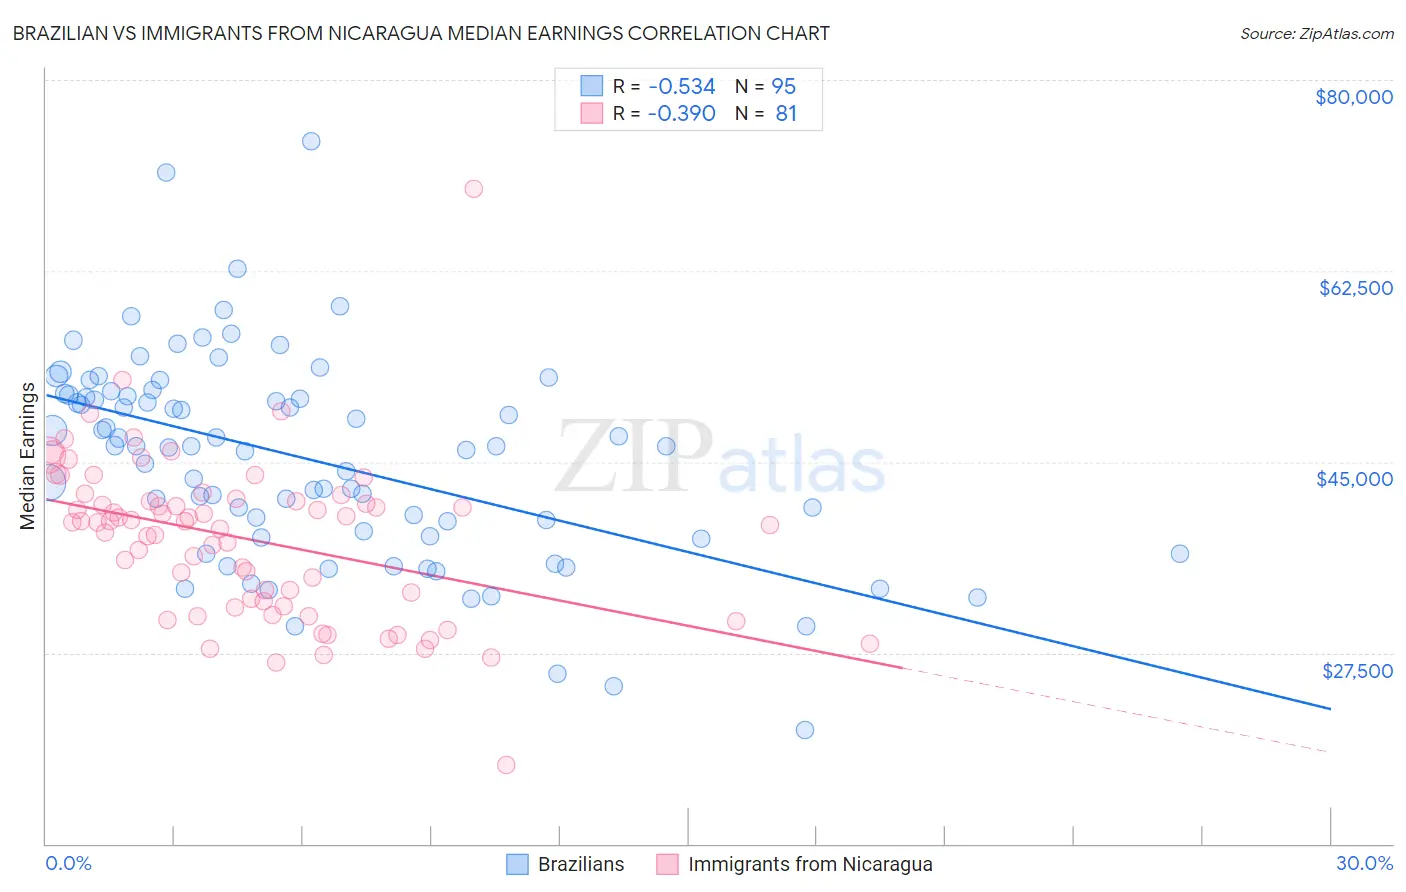
Brazilian vs Immigrants from Nicaragua Median Earnings Correlation Chart
The statistical analysis conducted on geographies consisting of 323,957,574 people shows a substantial negative correlation between the proportion of Brazilians and median earnings in the United States with a correlation coefficient (R) of -0.534 and weighted average of $48,356. Similarly, the statistical analysis conducted on geographies consisting of 236,337,785 people shows a mild negative correlation between the proportion of Immigrants from Nicaragua and median earnings in the United States with a correlation coefficient (R) of -0.390 and weighted average of $41,737, a difference of 15.9%.
Median Earnings Correlation Summary
| Measurement | Brazilian | Immigrants from Nicaragua |
| Minimum | $20,417 | $17,262 |
| Maximum | $74,375 | $70,084 |
| Range | $53,958 | $52,822 |
| Mean | $45,246 | $37,945 |
| Median | $46,406 | $39,498 |
| Interquartile 25% (IQ1) | $38,216 | $31,989 |
| Interquartile 75% (IQ3) | $51,116 | $41,525 |
| Interquartile Range (IQR) | $12,900 | $9,536 |
| Standard Deviation (Sample) | $9,424 | $7,439 |
| Standard Deviation (Population) | $9,375 | $7,393 |
Similar Demographics by Median Earnings
Demographics Similar to Brazilians by Median Earnings
In terms of median earnings, the demographic groups most similar to Brazilians are Immigrants from Syria ($48,375, a difference of 0.040%), Immigrants from Fiji ($48,305, a difference of 0.11%), Assyrian/Chaldean/Syriac ($48,304, a difference of 0.11%), Sierra Leonean ($48,286, a difference of 0.15%), and Immigrants from Philippines ($48,266, a difference of 0.19%).
| Demographics | Rating | Rank | Median Earnings |
| Serbians | 95.9 /100 | #117 | Exceptional $48,677 |
| Immigrants | Jordan | 95.9 /100 | #118 | Exceptional $48,673 |
| Poles | 95.8 /100 | #119 | Exceptional $48,659 |
| Carpatho Rusyns | 95.5 /100 | #120 | Exceptional $48,617 |
| Arabs | 95.4 /100 | #121 | Exceptional $48,599 |
| Chileans | 94.8 /100 | #122 | Exceptional $48,504 |
| Immigrants | Syria | 93.9 /100 | #123 | Exceptional $48,375 |
| Brazilians | 93.7 /100 | #124 | Exceptional $48,356 |
| Immigrants | Fiji | 93.3 /100 | #125 | Exceptional $48,305 |
| Assyrians/Chaldeans/Syriacs | 93.3 /100 | #126 | Exceptional $48,304 |
| Sierra Leoneans | 93.1 /100 | #127 | Exceptional $48,286 |
| Immigrants | Philippines | 92.9 /100 | #128 | Exceptional $48,266 |
| Pakistanis | 92.8 /100 | #129 | Exceptional $48,254 |
| Zimbabweans | 92.6 /100 | #130 | Exceptional $48,229 |
| Lebanese | 92.5 /100 | #131 | Exceptional $48,226 |
Demographics Similar to Immigrants from Nicaragua by Median Earnings
In terms of median earnings, the demographic groups most similar to Immigrants from Nicaragua are Mexican American Indian ($41,719, a difference of 0.040%), Indonesian ($41,701, a difference of 0.090%), Blackfeet ($41,822, a difference of 0.20%), Dominican ($41,864, a difference of 0.31%), and Immigrants from Dominican Republic ($41,554, a difference of 0.44%).
| Demographics | Rating | Rank | Median Earnings |
| Cajuns | 0.3 /100 | #278 | Tragic $42,189 |
| Colville | 0.2 /100 | #279 | Tragic $42,151 |
| Hmong | 0.2 /100 | #280 | Tragic $42,111 |
| Marshallese | 0.2 /100 | #281 | Tragic $41,969 |
| Africans | 0.2 /100 | #282 | Tragic $41,955 |
| Dominicans | 0.2 /100 | #283 | Tragic $41,864 |
| Blackfeet | 0.2 /100 | #284 | Tragic $41,822 |
| Immigrants | Nicaragua | 0.1 /100 | #285 | Tragic $41,737 |
| Mexican American Indians | 0.1 /100 | #286 | Tragic $41,719 |
| Indonesians | 0.1 /100 | #287 | Tragic $41,701 |
| Immigrants | Dominican Republic | 0.1 /100 | #288 | Tragic $41,554 |
| Comanche | 0.1 /100 | #289 | Tragic $41,519 |
| Paiute | 0.1 /100 | #290 | Tragic $41,508 |
| Central American Indians | 0.1 /100 | #291 | Tragic $41,474 |
| U.S. Virgin Islanders | 0.1 /100 | #292 | Tragic $41,448 |