Brazilian vs Iranian Vision Disability
COMPARE
Brazilian
Iranian
Vision Disability
Vision Disability Comparison
Brazilians
Iranians
2.1%
VISION DISABILITY
62.2/ 100
METRIC RATING
168th/ 347
METRIC RANK
1.8%
VISION DISABILITY
100.0/ 100
METRIC RATING
8th/ 347
METRIC RANK
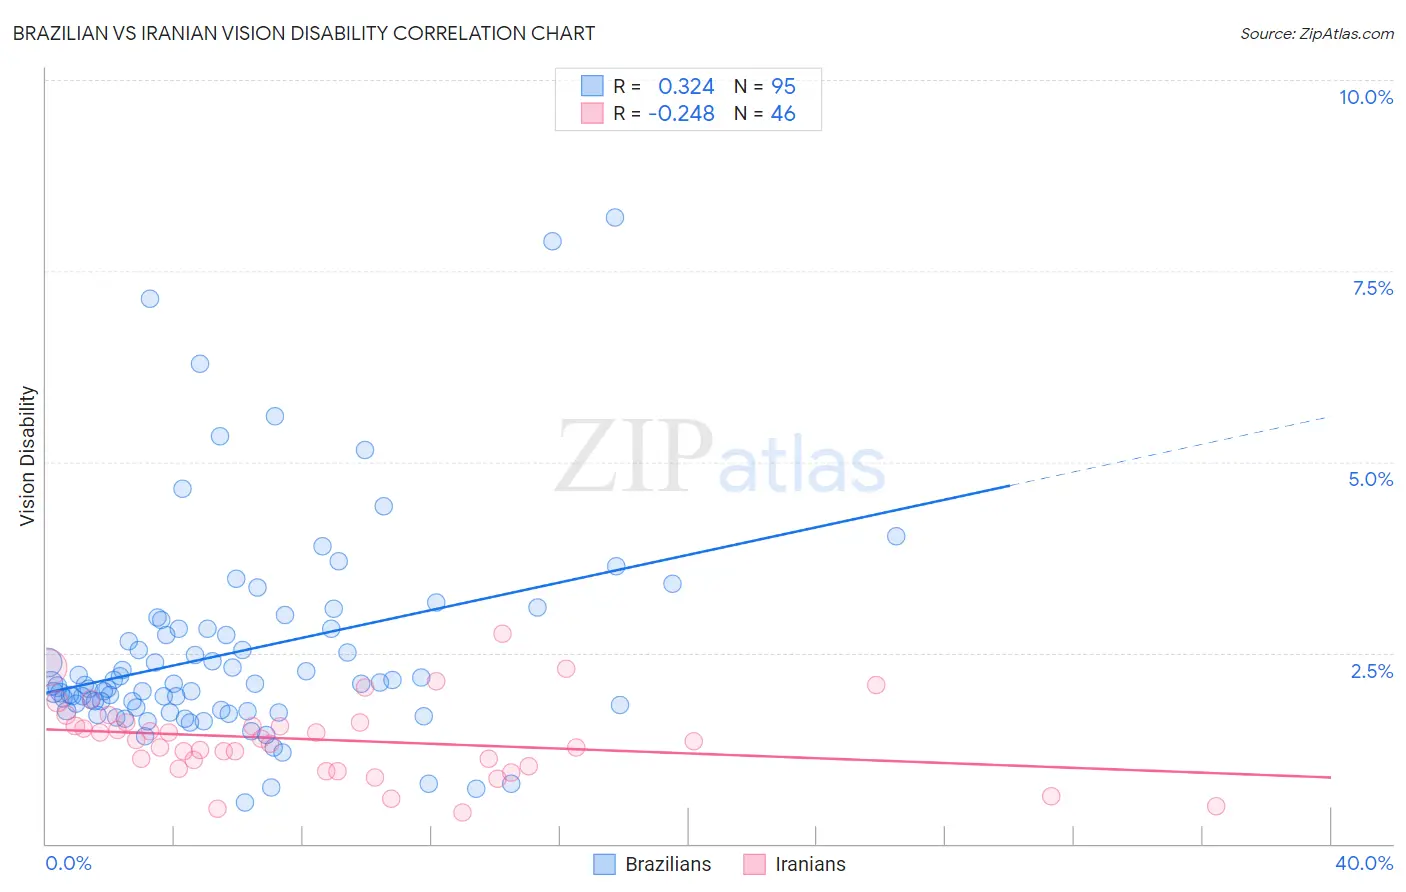
Brazilian vs Iranian Vision Disability Correlation Chart
The statistical analysis conducted on geographies consisting of 323,719,841 people shows a mild positive correlation between the proportion of Brazilians and percentage of population with vision disability in the United States with a correlation coefficient (R) of 0.324 and weighted average of 2.1%. Similarly, the statistical analysis conducted on geographies consisting of 316,677,046 people shows a weak negative correlation between the proportion of Iranians and percentage of population with vision disability in the United States with a correlation coefficient (R) of -0.248 and weighted average of 1.8%, a difference of 20.2%.
Vision Disability Correlation Summary
| Measurement | Brazilian | Iranian |
| Minimum | 0.54% | 0.41% |
| Maximum | 8.2% | 2.8% |
| Range | 7.7% | 2.3% |
| Mean | 2.5% | 1.4% |
| Median | 2.1% | 1.4% |
| Interquartile 25% (IQ1) | 1.7% | 1.0% |
| Interquartile 75% (IQ3) | 2.8% | 1.6% |
| Interquartile Range (IQR) | 1.1% | 0.57% |
| Standard Deviation (Sample) | 1.4% | 0.51% |
| Standard Deviation (Population) | 1.4% | 0.50% |
Similar Demographics by Vision Disability
Demographics Similar to Brazilians by Vision Disability
In terms of vision disability, the demographic groups most similar to Brazilians are Immigrants from Africa (2.1%, a difference of 0.030%), Immigrants from England (2.1%, a difference of 0.040%), Immigrants from Iraq (2.1%, a difference of 0.18%), Immigrants from Bangladesh (2.1%, a difference of 0.23%), and Icelander (2.1%, a difference of 0.27%).
| Demographics | Rating | Rank | Vision Disability |
| Iraqis | 67.7 /100 | #161 | Good 2.1% |
| Hungarians | 67.4 /100 | #162 | Good 2.1% |
| Icelanders | 66.1 /100 | #163 | Good 2.1% |
| Immigrants | Bangladesh | 65.5 /100 | #164 | Good 2.1% |
| Immigrants | Iraq | 64.8 /100 | #165 | Good 2.1% |
| Immigrants | England | 62.8 /100 | #166 | Good 2.1% |
| Immigrants | Africa | 62.6 /100 | #167 | Good 2.1% |
| Brazilians | 62.2 /100 | #168 | Good 2.1% |
| South American Indians | 57.4 /100 | #169 | Average 2.2% |
| Swiss | 55.7 /100 | #170 | Average 2.2% |
| Lebanese | 54.3 /100 | #171 | Average 2.2% |
| Northern Europeans | 50.1 /100 | #172 | Average 2.2% |
| Scandinavians | 50.0 /100 | #173 | Average 2.2% |
| Immigrants | Canada | 50.0 /100 | #174 | Average 2.2% |
| Immigrants | Fiji | 47.6 /100 | #175 | Average 2.2% |
Demographics Similar to Iranians by Vision Disability
In terms of vision disability, the demographic groups most similar to Iranians are Immigrants from South Central Asia (1.8%, a difference of 0.15%), Immigrants from Iran (1.8%, a difference of 0.21%), Immigrants from Singapore (1.8%, a difference of 0.74%), Okinawan (1.8%, a difference of 0.80%), and Immigrants from Hong Kong (1.8%, a difference of 0.93%).
| Demographics | Rating | Rank | Vision Disability |
| Immigrants | India | 100.0 /100 | #1 | Exceptional 1.7% |
| Filipinos | 100.0 /100 | #2 | Exceptional 1.7% |
| Immigrants | Taiwan | 100.0 /100 | #3 | Exceptional 1.7% |
| Thais | 100.0 /100 | #4 | Exceptional 1.7% |
| Okinawans | 100.0 /100 | #5 | Exceptional 1.8% |
| Immigrants | Iran | 100.0 /100 | #6 | Exceptional 1.8% |
| Immigrants | South Central Asia | 100.0 /100 | #7 | Exceptional 1.8% |
| Iranians | 100.0 /100 | #8 | Exceptional 1.8% |
| Immigrants | Singapore | 100.0 /100 | #9 | Exceptional 1.8% |
| Immigrants | Hong Kong | 100.0 /100 | #10 | Exceptional 1.8% |
| Immigrants | Israel | 100.0 /100 | #11 | Exceptional 1.8% |
| Immigrants | Korea | 100.0 /100 | #12 | Exceptional 1.8% |
| Immigrants | Eastern Asia | 100.0 /100 | #13 | Exceptional 1.8% |
| Immigrants | China | 100.0 /100 | #14 | Exceptional 1.8% |
| Immigrants | Bolivia | 100.0 /100 | #15 | Exceptional 1.8% |