Brazilian vs German Unemployment Among Ages 65 to 74 years
COMPARE
Brazilian
German
Unemployment Among Ages 65 to 74 years
Unemployment Among Ages 65 to 74 years Comparison
Brazilians
Germans
5.6%
UNEMPLOYMENT AMONG AGES 65 TO 74 YEARS
0.5/ 100
METRIC RATING
251st/ 347
METRIC RANK
5.1%
UNEMPLOYMENT AMONG AGES 65 TO 74 YEARS
99.5/ 100
METRIC RATING
58th/ 347
METRIC RANK
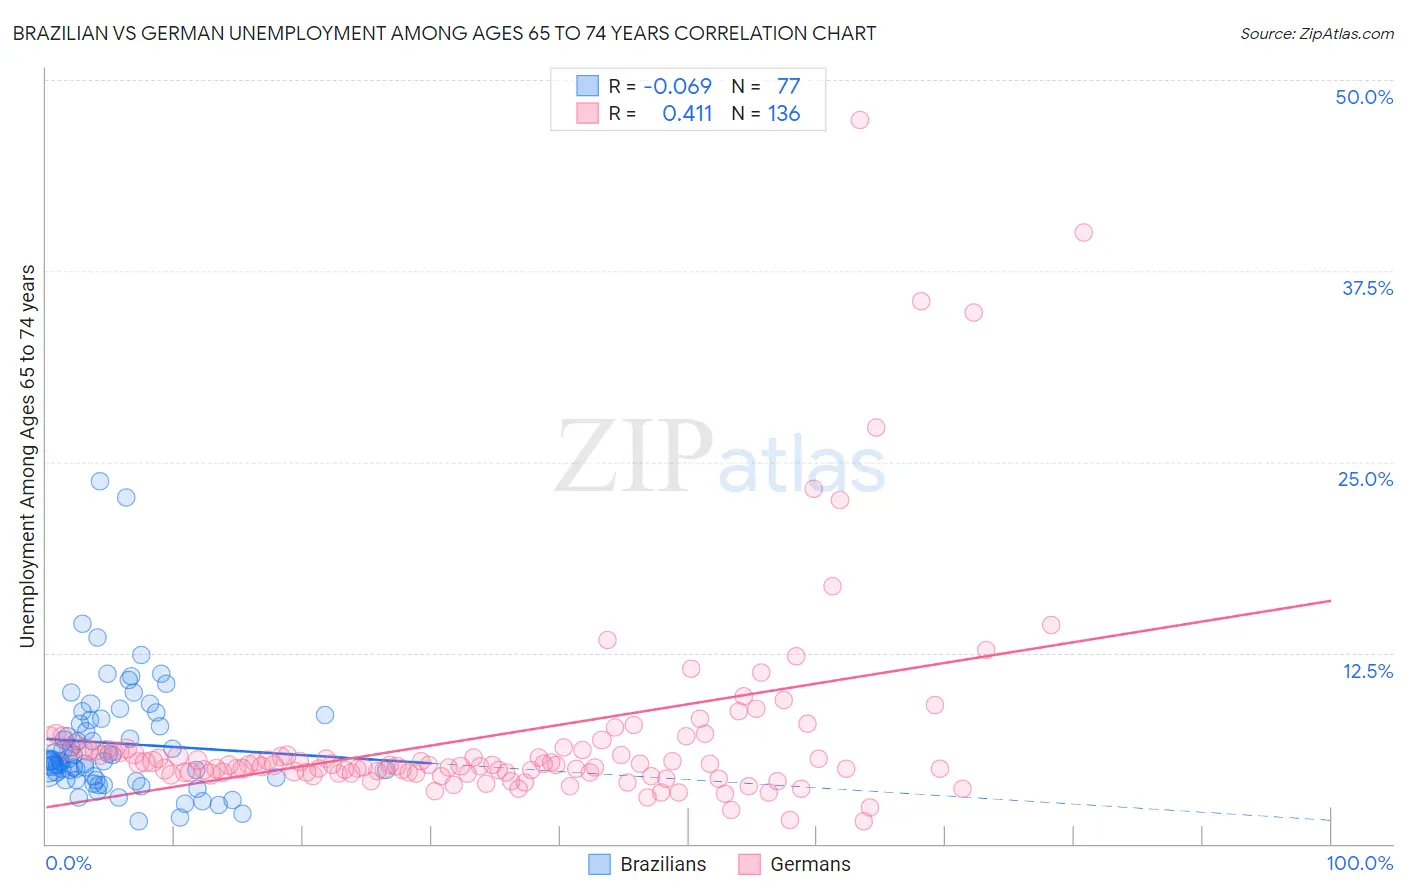
Brazilian vs German Unemployment Among Ages 65 to 74 years Correlation Chart
The statistical analysis conducted on geographies consisting of 294,175,837 people shows a slight negative correlation between the proportion of Brazilians and unemployment rate among population between the ages 65 and 74 in the United States with a correlation coefficient (R) of -0.069 and weighted average of 5.6%. Similarly, the statistical analysis conducted on geographies consisting of 447,999,375 people shows a moderate positive correlation between the proportion of Germans and unemployment rate among population between the ages 65 and 74 in the United States with a correlation coefficient (R) of 0.411 and weighted average of 5.1%, a difference of 9.1%.
Unemployment Among Ages 65 to 74 years Correlation Summary
| Measurement | Brazilian | German |
| Minimum | 1.5% | 1.5% |
| Maximum | 23.7% | 47.4% |
| Range | 22.2% | 45.9% |
| Mean | 6.6% | 7.0% |
| Median | 5.4% | 5.2% |
| Interquartile 25% (IQ1) | 4.3% | 4.6% |
| Interquartile 75% (IQ3) | 8.1% | 6.2% |
| Interquartile Range (IQR) | 3.9% | 1.5% |
| Standard Deviation (Sample) | 3.9% | 6.7% |
| Standard Deviation (Population) | 3.8% | 6.7% |
Similar Demographics by Unemployment Among Ages 65 to 74 years
Demographics Similar to Brazilians by Unemployment Among Ages 65 to 74 years
In terms of unemployment among ages 65 to 74 years, the demographic groups most similar to Brazilians are Colombian (5.6%, a difference of 0.040%), Immigrants from Brazil (5.6%, a difference of 0.10%), Immigrants from Costa Rica (5.6%, a difference of 0.12%), Immigrants from Haiti (5.6%, a difference of 0.21%), and Cape Verdean (5.6%, a difference of 0.26%).
| Demographics | Rating | Rank | Unemployment Among Ages 65 to 74 years |
| Immigrants | Micronesia | 0.9 /100 | #244 | Tragic 5.6% |
| Immigrants | Greece | 0.9 /100 | #245 | Tragic 5.6% |
| Paraguayans | 0.9 /100 | #246 | Tragic 5.6% |
| Immigrants | Immigrants | 0.9 /100 | #247 | Tragic 5.6% |
| Immigrants | Argentina | 0.9 /100 | #248 | Tragic 5.6% |
| Trinidadians and Tobagonians | 0.8 /100 | #249 | Tragic 5.6% |
| Cape Verdeans | 0.7 /100 | #250 | Tragic 5.6% |
| Brazilians | 0.5 /100 | #251 | Tragic 5.6% |
| Colombians | 0.5 /100 | #252 | Tragic 5.6% |
| Immigrants | Brazil | 0.5 /100 | #253 | Tragic 5.6% |
| Immigrants | Costa Rica | 0.5 /100 | #254 | Tragic 5.6% |
| Immigrants | Haiti | 0.4 /100 | #255 | Tragic 5.6% |
| Native Hawaiians | 0.4 /100 | #256 | Tragic 5.6% |
| Immigrants | Southern Europe | 0.3 /100 | #257 | Tragic 5.6% |
| Immigrants | Western Africa | 0.3 /100 | #258 | Tragic 5.6% |
Demographics Similar to Germans by Unemployment Among Ages 65 to 74 years
In terms of unemployment among ages 65 to 74 years, the demographic groups most similar to Germans are Swedish (5.1%, a difference of 0.050%), Croatian (5.1%, a difference of 0.050%), Immigrants from Bulgaria (5.1%, a difference of 0.050%), Immigrants from Jordan (5.1%, a difference of 0.10%), and Carpatho Rusyn (5.1%, a difference of 0.13%).
| Demographics | Rating | Rank | Unemployment Among Ages 65 to 74 years |
| Immigrants | Kazakhstan | 99.7 /100 | #51 | Exceptional 5.1% |
| Europeans | 99.6 /100 | #52 | Exceptional 5.1% |
| Immigrants | Ethiopia | 99.6 /100 | #53 | Exceptional 5.1% |
| Immigrants | Nicaragua | 99.6 /100 | #54 | Exceptional 5.1% |
| Carpatho Rusyns | 99.6 /100 | #55 | Exceptional 5.1% |
| Swedes | 99.5 /100 | #56 | Exceptional 5.1% |
| Croatians | 99.5 /100 | #57 | Exceptional 5.1% |
| Germans | 99.5 /100 | #58 | Exceptional 5.1% |
| Immigrants | Bulgaria | 99.4 /100 | #59 | Exceptional 5.1% |
| Immigrants | Jordan | 99.4 /100 | #60 | Exceptional 5.1% |
| Immigrants | Taiwan | 99.4 /100 | #61 | Exceptional 5.1% |
| Nicaraguans | 99.4 /100 | #62 | Exceptional 5.1% |
| Kiowa | 99.3 /100 | #63 | Exceptional 5.1% |
| Immigrants | Moldova | 99.3 /100 | #64 | Exceptional 5.1% |
| Bolivians | 99.3 /100 | #65 | Exceptional 5.1% |