Brazilian vs Syrian Disability Age Over 75
COMPARE
Brazilian
Syrian
Disability Age Over 75
Disability Age Over 75 Comparison
Brazilians
Syrians
46.5%
DISABILITY AGE OVER 75
96.6/ 100
METRIC RATING
108th/ 347
METRIC RANK
46.7%
DISABILITY AGE OVER 75
91.1/ 100
METRIC RATING
127th/ 347
METRIC RANK
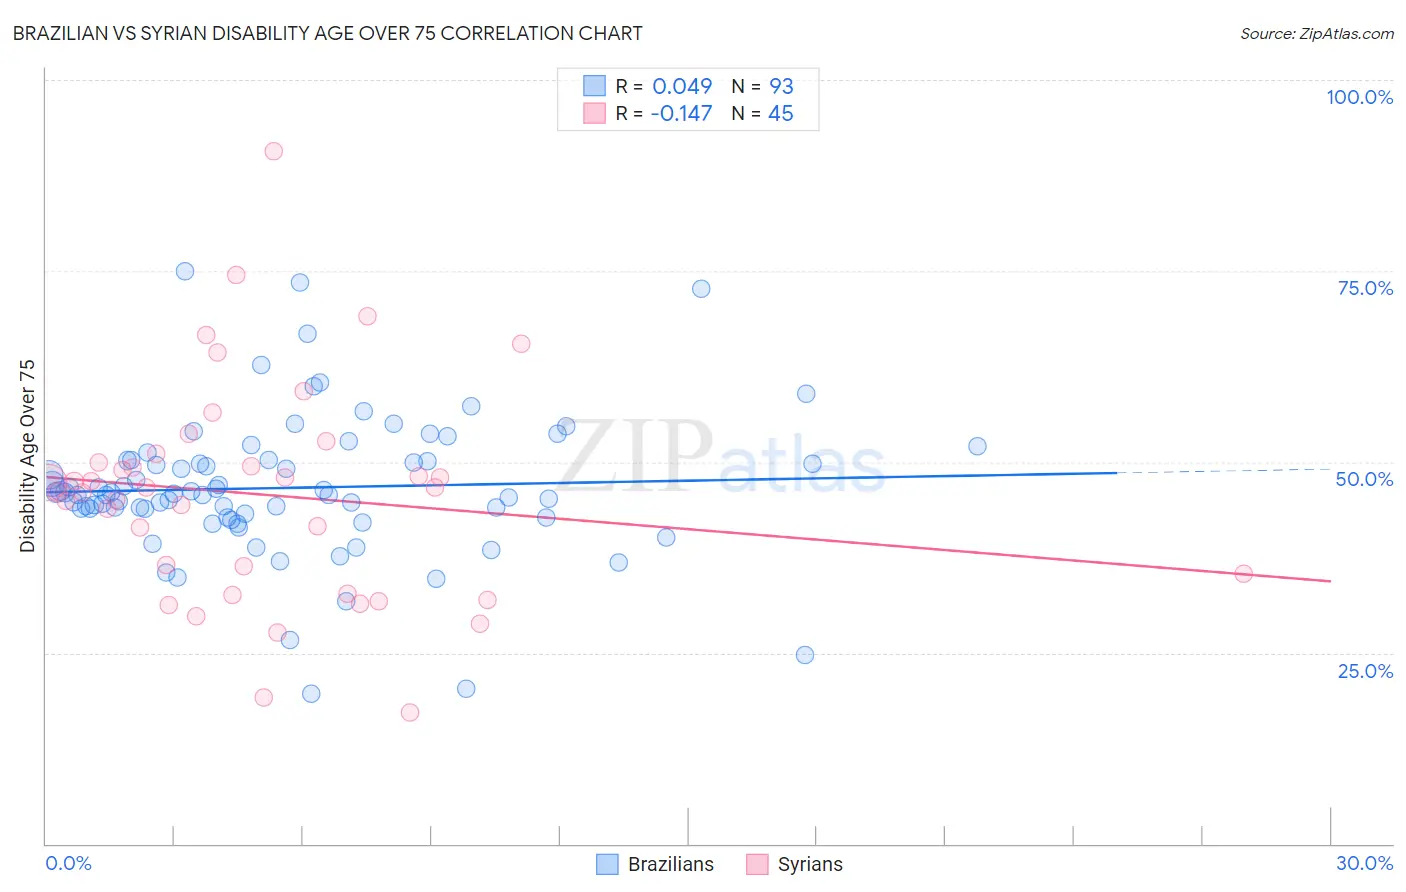
Brazilian vs Syrian Disability Age Over 75 Correlation Chart
The statistical analysis conducted on geographies consisting of 323,321,526 people shows no correlation between the proportion of Brazilians and percentage of population with a disability over the age of 75 in the United States with a correlation coefficient (R) of 0.049 and weighted average of 46.5%. Similarly, the statistical analysis conducted on geographies consisting of 266,003,851 people shows a poor negative correlation between the proportion of Syrians and percentage of population with a disability over the age of 75 in the United States with a correlation coefficient (R) of -0.147 and weighted average of 46.7%, a difference of 0.58%.
Disability Age Over 75 Correlation Summary
| Measurement | Brazilian | Syrian |
| Minimum | 19.7% | 17.1% |
| Maximum | 75.0% | 90.6% |
| Range | 55.3% | 73.5% |
| Mean | 46.6% | 45.7% |
| Median | 45.8% | 46.6% |
| Interquartile 25% (IQ1) | 42.9% | 34.1% |
| Interquartile 75% (IQ3) | 50.2% | 50.5% |
| Interquartile Range (IQR) | 7.3% | 16.5% |
| Standard Deviation (Sample) | 9.3% | 14.2% |
| Standard Deviation (Population) | 9.3% | 14.1% |
Demographics Similar to Brazilians and Syrians by Disability Age Over 75
In terms of disability age over 75, the demographic groups most similar to Brazilians are Immigrants from Uruguay (46.4%, a difference of 0.010%), Chilean (46.5%, a difference of 0.030%), Immigrants from Hong Kong (46.5%, a difference of 0.040%), Immigrants from Chile (46.5%, a difference of 0.040%), and Immigrants from Pakistan (46.5%, a difference of 0.080%). Similarly, the demographic groups most similar to Syrians are European (46.7%, a difference of 0.010%), Colombian (46.7%, a difference of 0.020%), Immigrants from South America (46.7%, a difference of 0.050%), Immigrants from Colombia (46.7%, a difference of 0.11%), and Immigrants from Albania (46.6%, a difference of 0.16%).
| Demographics | Rating | Rank | Disability Age Over 75 |
| Immigrants | Uruguay | 96.7 /100 | #107 | Exceptional 46.4% |
| Brazilians | 96.6 /100 | #108 | Exceptional 46.5% |
| Chileans | 96.4 /100 | #109 | Exceptional 46.5% |
| Immigrants | Hong Kong | 96.4 /100 | #110 | Exceptional 46.5% |
| Immigrants | Chile | 96.4 /100 | #111 | Exceptional 46.5% |
| Immigrants | Pakistan | 96.1 /100 | #112 | Exceptional 46.5% |
| Irish | 96.0 /100 | #113 | Exceptional 46.5% |
| Dutch | 95.9 /100 | #114 | Exceptional 46.5% |
| British | 95.7 /100 | #115 | Exceptional 46.5% |
| Indians (Asian) | 95.7 /100 | #116 | Exceptional 46.5% |
| Hungarians | 95.3 /100 | #117 | Exceptional 46.5% |
| Czechoslovakians | 94.7 /100 | #118 | Exceptional 46.6% |
| Canadians | 94.4 /100 | #119 | Exceptional 46.6% |
| Immigrants | Nepal | 94.1 /100 | #120 | Exceptional 46.6% |
| Scandinavians | 93.6 /100 | #121 | Exceptional 46.6% |
| Immigrants | Albania | 93.2 /100 | #122 | Exceptional 46.6% |
| Immigrants | Colombia | 92.6 /100 | #123 | Exceptional 46.7% |
| Immigrants | South America | 91.8 /100 | #124 | Exceptional 46.7% |
| Colombians | 91.3 /100 | #125 | Exceptional 46.7% |
| Europeans | 91.2 /100 | #126 | Exceptional 46.7% |
| Syrians | 91.1 /100 | #127 | Exceptional 46.7% |