Bolivian vs Immigrants from Australia Disability Age Over 75
COMPARE
Bolivian
Immigrants from Australia
Disability Age Over 75
Disability Age Over 75 Comparison
Bolivians
Immigrants from Australia
45.2%
DISABILITY AGE OVER 75
100.0/ 100
METRIC RATING
18th/ 347
METRIC RANK
45.5%
DISABILITY AGE OVER 75
99.9/ 100
METRIC RATING
32nd/ 347
METRIC RANK
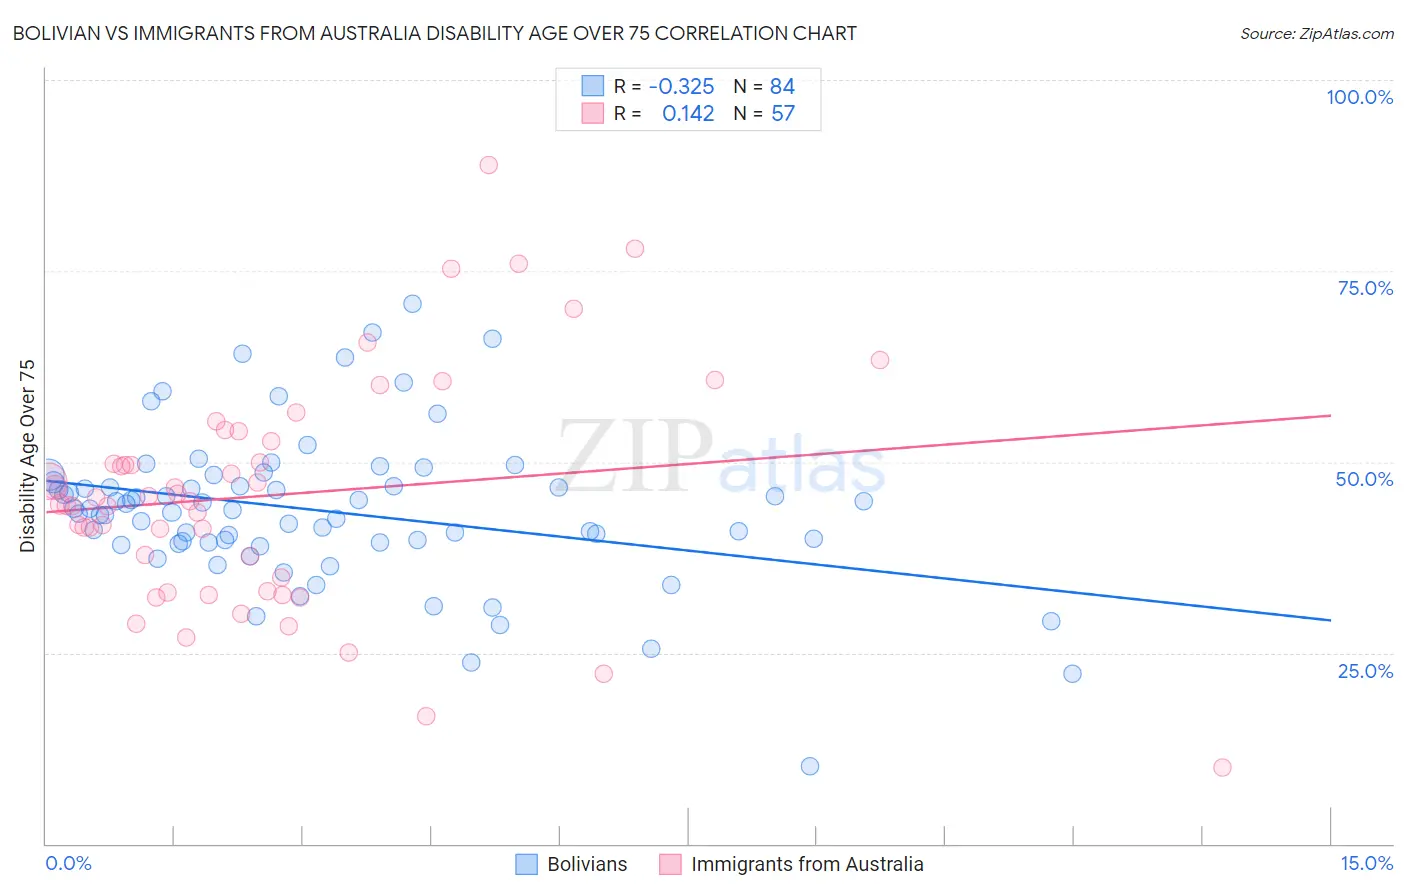
Bolivian vs Immigrants from Australia Disability Age Over 75 Correlation Chart
The statistical analysis conducted on geographies consisting of 184,497,554 people shows a mild negative correlation between the proportion of Bolivians and percentage of population with a disability over the age of 75 in the United States with a correlation coefficient (R) of -0.325 and weighted average of 45.2%. Similarly, the statistical analysis conducted on geographies consisting of 226,989,028 people shows a poor positive correlation between the proportion of Immigrants from Australia and percentage of population with a disability over the age of 75 in the United States with a correlation coefficient (R) of 0.142 and weighted average of 45.5%, a difference of 0.61%.
Disability Age Over 75 Correlation Summary
| Measurement | Bolivian | Immigrants from Australia |
| Minimum | 10.2% | 10.0% |
| Maximum | 70.7% | 88.9% |
| Range | 60.5% | 78.9% |
| Mean | 43.6% | 45.6% |
| Median | 43.8% | 44.8% |
| Interquartile 25% (IQ1) | 39.4% | 34.0% |
| Interquartile 75% (IQ3) | 47.1% | 53.3% |
| Interquartile Range (IQR) | 7.7% | 19.4% |
| Standard Deviation (Sample) | 10.0% | 15.1% |
| Standard Deviation (Population) | 9.9% | 15.0% |
Demographics Similar to Bolivians and Immigrants from Australia by Disability Age Over 75
In terms of disability age over 75, the demographic groups most similar to Bolivians are Immigrants from Greece (45.2%, a difference of 0.010%), Immigrants from India (45.2%, a difference of 0.030%), Immigrants from Northern Europe (45.2%, a difference of 0.040%), Immigrants from Serbia (45.3%, a difference of 0.11%), and Immigrants from Sweden (45.1%, a difference of 0.13%). Similarly, the demographic groups most similar to Immigrants from Australia are Immigrants from Bulgaria (45.5%, a difference of 0.030%), Immigrants from Croatia (45.5%, a difference of 0.060%), Immigrants from Denmark (45.4%, a difference of 0.10%), Russian (45.5%, a difference of 0.10%), and Norwegian (45.5%, a difference of 0.10%).
| Demographics | Rating | Rank | Disability Age Over 75 |
| Immigrants | Sweden | 100.0 /100 | #15 | Exceptional 45.1% |
| Immigrants | Northern Europe | 100.0 /100 | #16 | Exceptional 45.2% |
| Immigrants | India | 100.0 /100 | #17 | Exceptional 45.2% |
| Bolivians | 100.0 /100 | #18 | Exceptional 45.2% |
| Immigrants | Greece | 100.0 /100 | #19 | Exceptional 45.2% |
| Immigrants | Serbia | 100.0 /100 | #20 | Exceptional 45.3% |
| Immigrants | Belgium | 100.0 /100 | #21 | Exceptional 45.3% |
| Immigrants | South Africa | 100.0 /100 | #22 | Exceptional 45.3% |
| Immigrants | Switzerland | 99.9 /100 | #23 | Exceptional 45.3% |
| Poles | 99.9 /100 | #24 | Exceptional 45.3% |
| Immigrants | Bolivia | 99.9 /100 | #25 | Exceptional 45.4% |
| Macedonians | 99.9 /100 | #26 | Exceptional 45.4% |
| Immigrants | Poland | 99.9 /100 | #27 | Exceptional 45.4% |
| Thais | 99.9 /100 | #28 | Exceptional 45.4% |
| Filipinos | 99.9 /100 | #29 | Exceptional 45.4% |
| Immigrants | Denmark | 99.9 /100 | #30 | Exceptional 45.4% |
| Immigrants | Bulgaria | 99.9 /100 | #31 | Exceptional 45.5% |
| Immigrants | Australia | 99.9 /100 | #32 | Exceptional 45.5% |
| Immigrants | Croatia | 99.9 /100 | #33 | Exceptional 45.5% |
| Russians | 99.9 /100 | #34 | Exceptional 45.5% |
| Norwegians | 99.9 /100 | #35 | Exceptional 45.5% |