Bolivian vs Yuman Doctorate Degree
COMPARE
Bolivian
Yuman
Doctorate Degree
Doctorate Degree Comparison
Bolivians
Yuman
2.4%
DOCTORATE DEGREE
100.0/ 100
METRIC RATING
55th/ 347
METRIC RANK
1.5%
DOCTORATE DEGREE
1.1/ 100
METRIC RATING
252nd/ 347
METRIC RANK
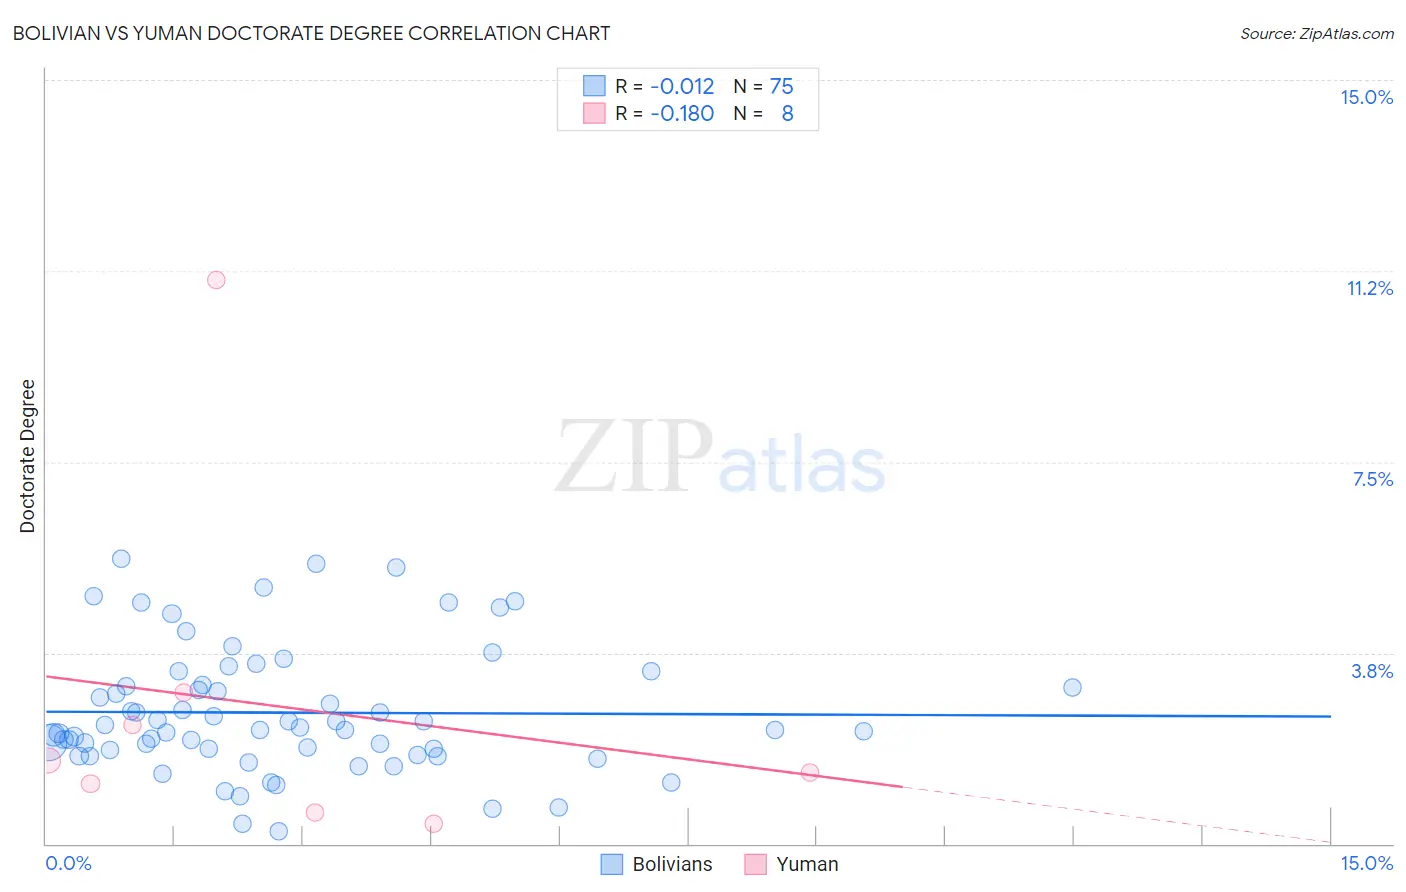
Bolivian vs Yuman Doctorate Degree Correlation Chart
The statistical analysis conducted on geographies consisting of 184,113,611 people shows no correlation between the proportion of Bolivians and percentage of population with at least doctorate degree education in the United States with a correlation coefficient (R) of -0.012 and weighted average of 2.4%. Similarly, the statistical analysis conducted on geographies consisting of 40,365,852 people shows a poor negative correlation between the proportion of Yuman and percentage of population with at least doctorate degree education in the United States with a correlation coefficient (R) of -0.180 and weighted average of 1.5%, a difference of 54.3%.
Doctorate Degree Correlation Summary
| Measurement | Bolivian | Yuman |
| Minimum | 0.25% | 0.38% |
| Maximum | 5.6% | 11.1% |
| Range | 5.3% | 10.7% |
| Mean | 2.6% | 2.7% |
| Median | 2.2% | 1.5% |
| Interquartile 25% (IQ1) | 1.8% | 0.89% |
| Interquartile 75% (IQ3) | 3.1% | 2.7% |
| Interquartile Range (IQR) | 1.3% | 1.8% |
| Standard Deviation (Sample) | 1.2% | 3.5% |
| Standard Deviation (Population) | 1.2% | 3.3% |
Similar Demographics by Doctorate Degree
Demographics Similar to Bolivians by Doctorate Degree
In terms of doctorate degree, the demographic groups most similar to Bolivians are Immigrants from Indonesia (2.4%, a difference of 0.080%), Immigrants from Czechoslovakia (2.4%, a difference of 0.090%), Immigrants from Ethiopia (2.4%, a difference of 0.53%), Ethiopian (2.3%, a difference of 0.65%), and Immigrants from Latvia (2.4%, a difference of 0.76%).
| Demographics | Rating | Rank | Doctorate Degree |
| Asians | 100.0 /100 | #48 | Exceptional 2.4% |
| Immigrants | Asia | 100.0 /100 | #49 | Exceptional 2.4% |
| Immigrants | Norway | 100.0 /100 | #50 | Exceptional 2.4% |
| Australians | 100.0 /100 | #51 | Exceptional 2.4% |
| Bulgarians | 100.0 /100 | #52 | Exceptional 2.4% |
| Immigrants | Latvia | 100.0 /100 | #53 | Exceptional 2.4% |
| Immigrants | Indonesia | 100.0 /100 | #54 | Exceptional 2.4% |
| Bolivians | 100.0 /100 | #55 | Exceptional 2.4% |
| Immigrants | Czechoslovakia | 100.0 /100 | #56 | Exceptional 2.4% |
| Immigrants | Ethiopia | 100.0 /100 | #57 | Exceptional 2.4% |
| Ethiopians | 99.9 /100 | #58 | Exceptional 2.3% |
| South Africans | 99.9 /100 | #59 | Exceptional 2.3% |
| Immigrants | Serbia | 99.9 /100 | #60 | Exceptional 2.3% |
| Bhutanese | 99.9 /100 | #61 | Exceptional 2.3% |
| Immigrants | Europe | 99.9 /100 | #62 | Exceptional 2.3% |
Demographics Similar to Yuman by Doctorate Degree
In terms of doctorate degree, the demographic groups most similar to Yuman are American (1.5%, a difference of 0.15%), Immigrants from Cambodia (1.5%, a difference of 0.28%), Trinidadian and Tobagonian (1.5%, a difference of 0.28%), Central American Indian (1.5%, a difference of 0.33%), and Chippewa (1.5%, a difference of 0.55%).
| Demographics | Rating | Rank | Doctorate Degree |
| Delaware | 1.9 /100 | #245 | Tragic 1.6% |
| Hmong | 1.8 /100 | #246 | Tragic 1.6% |
| Comanche | 1.8 /100 | #247 | Tragic 1.6% |
| Africans | 1.8 /100 | #248 | Tragic 1.6% |
| Potawatomi | 1.6 /100 | #249 | Tragic 1.6% |
| Immigrants | Fiji | 1.6 /100 | #250 | Tragic 1.6% |
| Apache | 1.3 /100 | #251 | Tragic 1.5% |
| Yuman | 1.1 /100 | #252 | Tragic 1.5% |
| Americans | 1.0 /100 | #253 | Tragic 1.5% |
| Immigrants | Cambodia | 1.0 /100 | #254 | Tragic 1.5% |
| Trinidadians and Tobagonians | 1.0 /100 | #255 | Tragic 1.5% |
| Central American Indians | 1.0 /100 | #256 | Tragic 1.5% |
| Chippewa | 0.9 /100 | #257 | Tragic 1.5% |
| Immigrants | West Indies | 0.9 /100 | #258 | Tragic 1.5% |
| Liberians | 0.9 /100 | #259 | Tragic 1.5% |