Immigrants from Ireland vs Immigrants from Zimbabwe Hearing Disability
COMPARE
Immigrants from Ireland
Immigrants from Zimbabwe
Hearing Disability
Hearing Disability Comparison
Immigrants from Ireland
Immigrants from Zimbabwe
3.0%
HEARING DISABILITY
37.4/ 100
METRIC RATING
184th/ 347
METRIC RANK
3.0%
HEARING DISABILITY
64.2/ 100
METRIC RATING
165th/ 347
METRIC RANK
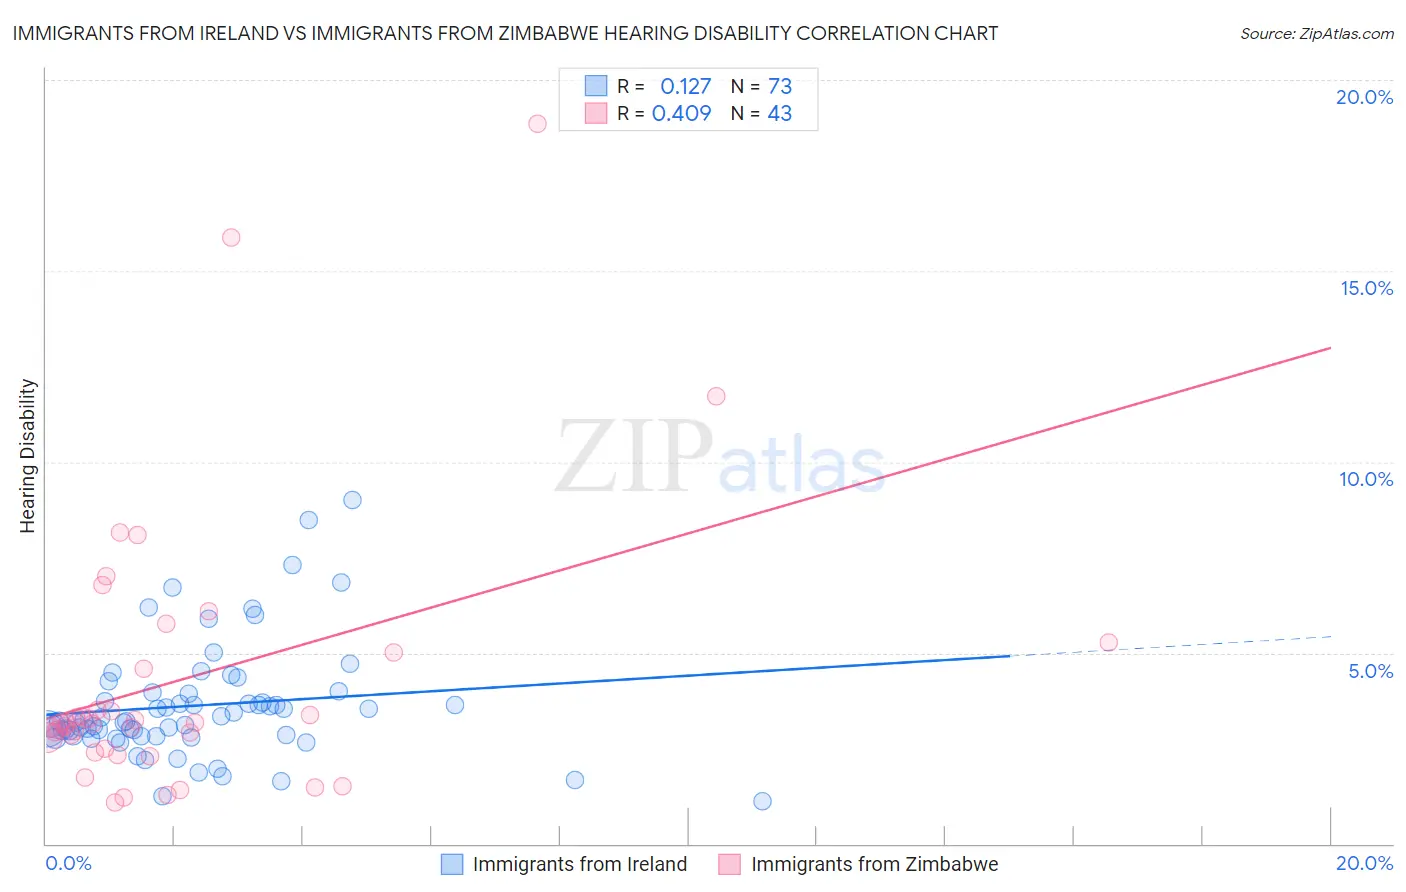
Immigrants from Ireland vs Immigrants from Zimbabwe Hearing Disability Correlation Chart
The statistical analysis conducted on geographies consisting of 240,758,796 people shows a poor positive correlation between the proportion of Immigrants from Ireland and percentage of population with hearing disability in the United States with a correlation coefficient (R) of 0.127 and weighted average of 3.0%. Similarly, the statistical analysis conducted on geographies consisting of 117,807,709 people shows a moderate positive correlation between the proportion of Immigrants from Zimbabwe and percentage of population with hearing disability in the United States with a correlation coefficient (R) of 0.409 and weighted average of 3.0%, a difference of 2.6%.
Hearing Disability Correlation Summary
| Measurement | Immigrants from Ireland | Immigrants from Zimbabwe |
| Minimum | 1.1% | 1.1% |
| Maximum | 9.0% | 18.9% |
| Range | 7.9% | 17.8% |
| Mean | 3.6% | 4.3% |
| Median | 3.2% | 3.2% |
| Interquartile 25% (IQ1) | 2.8% | 2.5% |
| Interquartile 75% (IQ3) | 3.9% | 5.0% |
| Interquartile Range (IQR) | 1.1% | 2.5% |
| Standard Deviation (Sample) | 1.5% | 3.6% |
| Standard Deviation (Population) | 1.5% | 3.6% |
Demographics Similar to Immigrants from Ireland and Immigrants from Zimbabwe by Hearing Disability
In terms of hearing disability, the demographic groups most similar to Immigrants from Ireland are Bulgarian (3.0%, a difference of 0.23%), Immigrants from Italy (3.0%, a difference of 0.37%), Immigrants from Belgium (3.0%, a difference of 0.40%), Immigrants from Sweden (3.0%, a difference of 0.49%), and Immigrants from Moldova (3.0%, a difference of 0.55%). Similarly, the demographic groups most similar to Immigrants from Zimbabwe are Immigrants from Cambodia (3.0%, a difference of 0.060%), Immigrants from South Eastern Asia (3.0%, a difference of 0.14%), Immigrants from Eastern Europe (3.0%, a difference of 0.61%), Immigrants from Greece (3.0%, a difference of 0.63%), and Arab (3.0%, a difference of 0.66%).
| Demographics | Rating | Rank | Hearing Disability |
| Immigrants | Cambodia | 64.8 /100 | #164 | Good 3.0% |
| Immigrants | Zimbabwe | 64.2 /100 | #165 | Good 3.0% |
| Immigrants | South Eastern Asia | 62.9 /100 | #166 | Good 3.0% |
| Immigrants | Eastern Europe | 58.1 /100 | #167 | Average 3.0% |
| Immigrants | Greece | 57.9 /100 | #168 | Average 3.0% |
| Arabs | 57.6 /100 | #169 | Average 3.0% |
| Immigrants | Cabo Verde | 56.9 /100 | #170 | Average 3.0% |
| Immigrants | Ukraine | 56.6 /100 | #171 | Average 3.0% |
| Armenians | 56.0 /100 | #172 | Average 3.0% |
| Immigrants | Serbia | 51.1 /100 | #173 | Average 3.0% |
| Indonesians | 50.0 /100 | #174 | Average 3.0% |
| Immigrants | Romania | 48.4 /100 | #175 | Average 3.0% |
| Panamanians | 47.0 /100 | #176 | Average 3.0% |
| Immigrants | Philippines | 46.4 /100 | #177 | Average 3.0% |
| Japanese | 46.0 /100 | #178 | Average 3.0% |
| Immigrants | Moldova | 43.1 /100 | #179 | Average 3.0% |
| Immigrants | Sweden | 42.4 /100 | #180 | Average 3.0% |
| Immigrants | Belgium | 41.5 /100 | #181 | Average 3.0% |
| Immigrants | Italy | 41.1 /100 | #182 | Average 3.0% |
| Bulgarians | 39.7 /100 | #183 | Fair 3.0% |
| Immigrants | Ireland | 37.4 /100 | #184 | Fair 3.0% |