Laotian vs South American Hearing Disability
COMPARE
Laotian
South American
Hearing Disability
Hearing Disability Comparison
Laotians
South Americans
2.9%
HEARING DISABILITY
81.1/ 100
METRIC RATING
142nd/ 347
METRIC RANK
2.7%
HEARING DISABILITY
99.0/ 100
METRIC RATING
57th/ 347
METRIC RANK
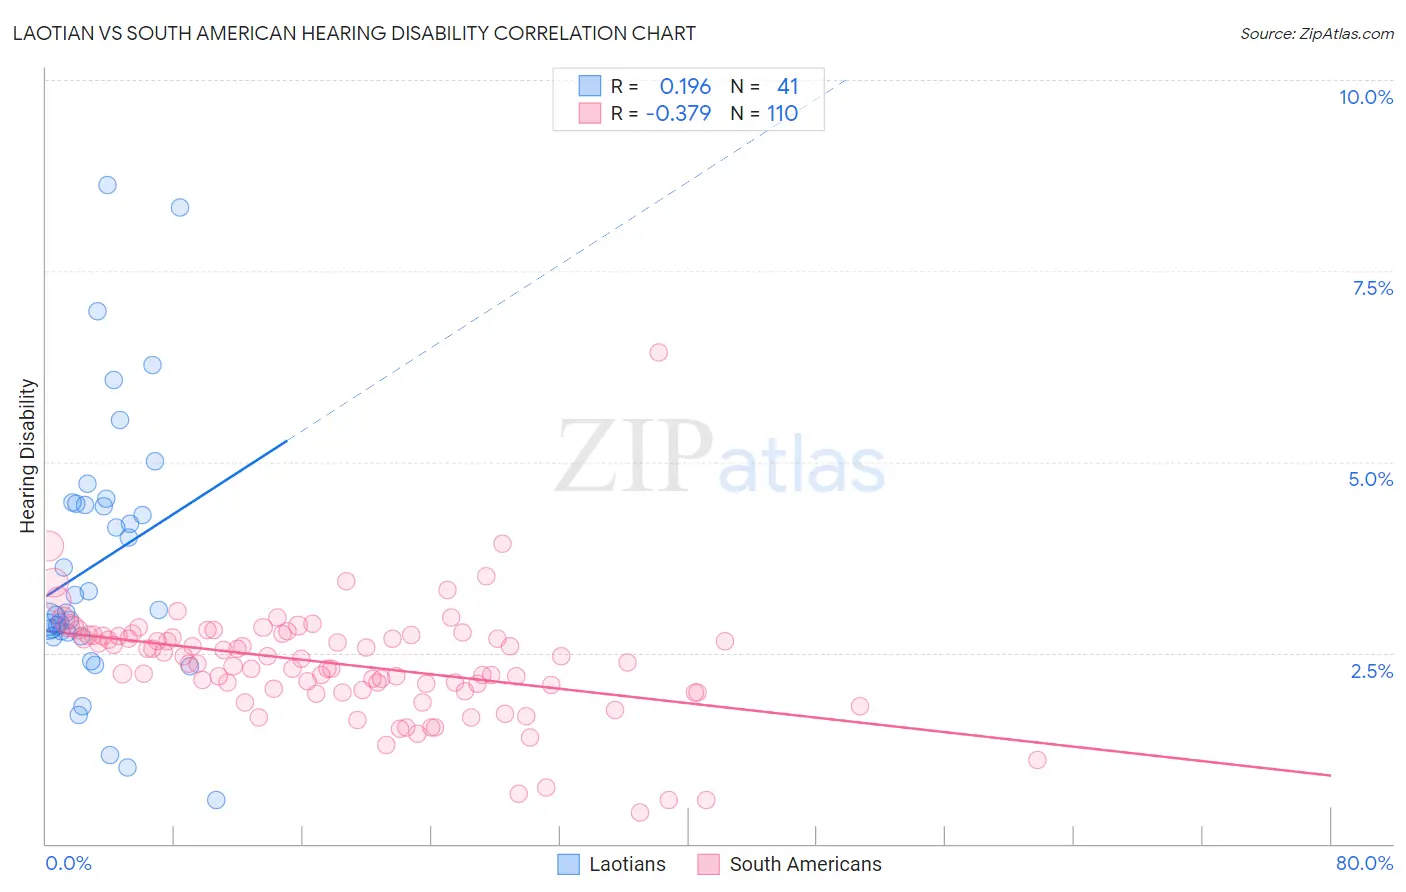
Laotian vs South American Hearing Disability Correlation Chart
The statistical analysis conducted on geographies consisting of 224,832,654 people shows a poor positive correlation between the proportion of Laotians and percentage of population with hearing disability in the United States with a correlation coefficient (R) of 0.196 and weighted average of 2.9%. Similarly, the statistical analysis conducted on geographies consisting of 493,776,851 people shows a mild negative correlation between the proportion of South Americans and percentage of population with hearing disability in the United States with a correlation coefficient (R) of -0.379 and weighted average of 2.7%, a difference of 8.1%.
Hearing Disability Correlation Summary
| Measurement | Laotian | South American |
| Minimum | 0.57% | 0.40% |
| Maximum | 8.6% | 6.4% |
| Range | 8.0% | 6.0% |
| Mean | 3.7% | 2.4% |
| Median | 3.1% | 2.4% |
| Interquartile 25% (IQ1) | 2.7% | 2.0% |
| Interquartile 75% (IQ3) | 4.5% | 2.7% |
| Interquartile Range (IQR) | 1.7% | 0.71% |
| Standard Deviation (Sample) | 1.8% | 0.75% |
| Standard Deviation (Population) | 1.7% | 0.75% |
Similar Demographics by Hearing Disability
Demographics Similar to Laotians by Hearing Disability
In terms of hearing disability, the demographic groups most similar to Laotians are Immigrants from Bahamas (2.9%, a difference of 0.020%), Immigrants from Bulgaria (2.9%, a difference of 0.29%), Immigrants from Congo (2.9%, a difference of 0.34%), Brazilian (2.9%, a difference of 0.36%), and Subsaharan African (2.9%, a difference of 0.37%).
| Demographics | Rating | Rank | Hearing Disability |
| Soviet Union | 84.8 /100 | #135 | Excellent 2.9% |
| Immigrants | Brazil | 84.6 /100 | #136 | Excellent 2.9% |
| Sri Lankans | 84.1 /100 | #137 | Excellent 2.9% |
| Immigrants | Costa Rica | 84.0 /100 | #138 | Excellent 2.9% |
| Bermudans | 83.8 /100 | #139 | Excellent 2.9% |
| Immigrants | Jordan | 83.7 /100 | #140 | Excellent 2.9% |
| Sub-Saharan Africans | 83.3 /100 | #141 | Excellent 2.9% |
| Laotians | 81.1 /100 | #142 | Excellent 2.9% |
| Immigrants | Bahamas | 80.9 /100 | #143 | Excellent 2.9% |
| Immigrants | Bulgaria | 79.2 /100 | #144 | Good 2.9% |
| Immigrants | Congo | 78.9 /100 | #145 | Good 2.9% |
| Brazilians | 78.7 /100 | #146 | Good 2.9% |
| Tongans | 78.6 /100 | #147 | Good 2.9% |
| Immigrants | Russia | 77.7 /100 | #148 | Good 2.9% |
| Immigrants | Panama | 76.9 /100 | #149 | Good 2.9% |
Demographics Similar to South Americans by Hearing Disability
In terms of hearing disability, the demographic groups most similar to South Americans are Immigrants from Nicaragua (2.7%, a difference of 0.040%), Immigrants from Ethiopia (2.7%, a difference of 0.070%), Ethiopian (2.7%, a difference of 0.13%), Immigrants from Eastern Asia (2.7%, a difference of 0.16%), and Jamaican (2.7%, a difference of 0.23%).
| Demographics | Rating | Rank | Hearing Disability |
| Paraguayans | 99.2 /100 | #50 | Exceptional 2.7% |
| Immigrants | Hong Kong | 99.2 /100 | #51 | Exceptional 2.7% |
| Jamaicans | 99.0 /100 | #52 | Exceptional 2.7% |
| Immigrants | Eastern Asia | 99.0 /100 | #53 | Exceptional 2.7% |
| Ethiopians | 99.0 /100 | #54 | Exceptional 2.7% |
| Immigrants | Ethiopia | 99.0 /100 | #55 | Exceptional 2.7% |
| Immigrants | Nicaragua | 99.0 /100 | #56 | Exceptional 2.7% |
| South Americans | 99.0 /100 | #57 | Exceptional 2.7% |
| Immigrants | Peru | 98.6 /100 | #58 | Exceptional 2.7% |
| Immigrants | Eritrea | 98.5 /100 | #59 | Exceptional 2.7% |
| Immigrants | Egypt | 98.5 /100 | #60 | Exceptional 2.7% |
| Immigrants | Uzbekistan | 98.4 /100 | #61 | Exceptional 2.7% |
| Immigrants | Colombia | 98.4 /100 | #62 | Exceptional 2.7% |
| Indians (Asian) | 98.4 /100 | #63 | Exceptional 2.7% |
| Immigrants | Sri Lanka | 98.4 /100 | #64 | Exceptional 2.7% |