Immigrants from Ghana vs South American Hearing Disability
COMPARE
Immigrants from Ghana
South American
Hearing Disability
Hearing Disability Comparison
Immigrants from Ghana
South Americans
2.6%
HEARING DISABILITY
99.8/ 100
METRIC RATING
24th/ 347
METRIC RANK
2.7%
HEARING DISABILITY
99.0/ 100
METRIC RATING
57th/ 347
METRIC RANK
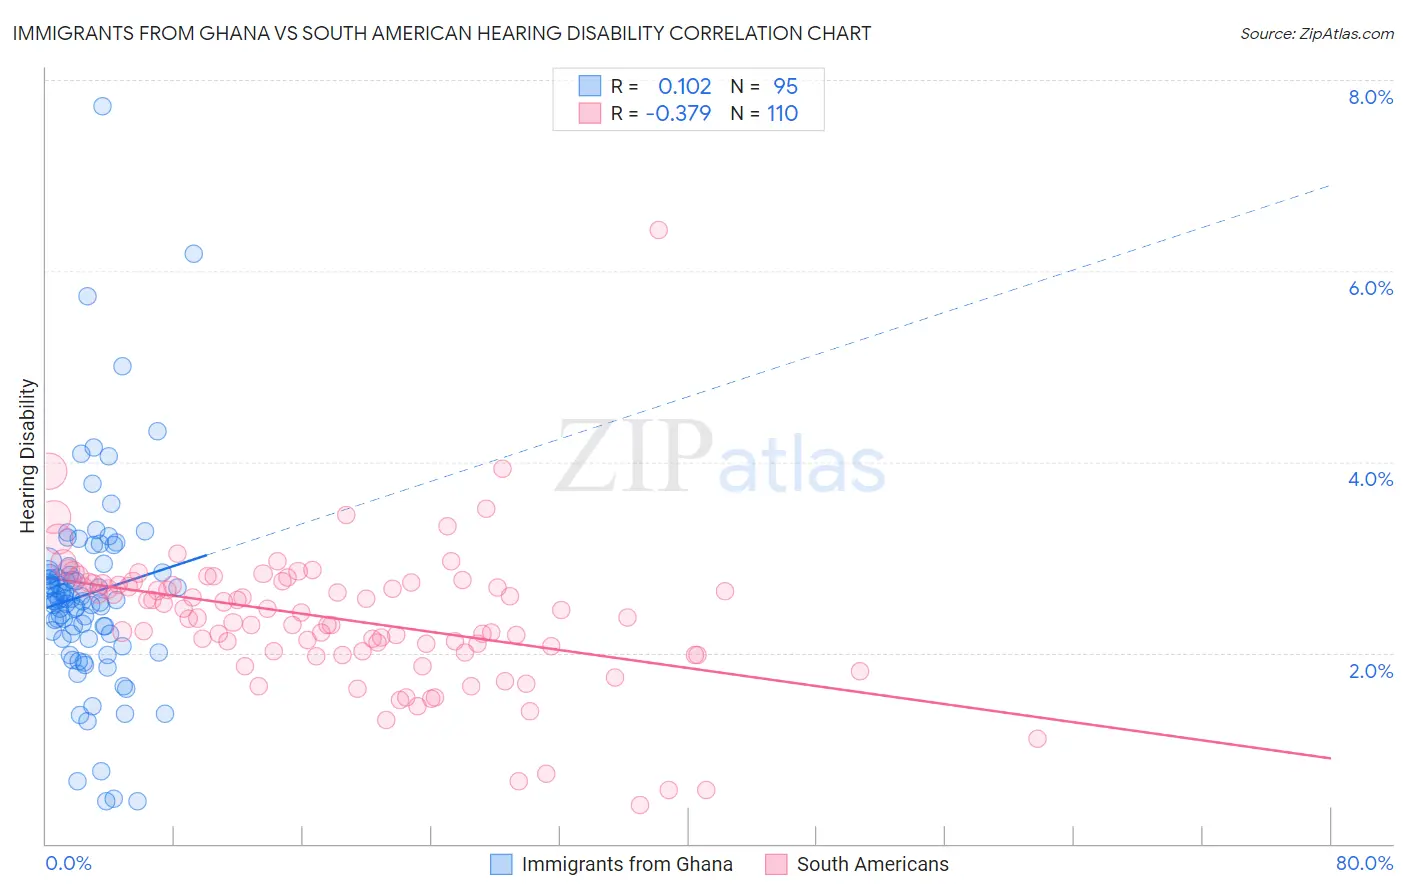
Immigrants from Ghana vs South American Hearing Disability Correlation Chart
The statistical analysis conducted on geographies consisting of 199,883,907 people shows a poor positive correlation between the proportion of Immigrants from Ghana and percentage of population with hearing disability in the United States with a correlation coefficient (R) of 0.102 and weighted average of 2.6%. Similarly, the statistical analysis conducted on geographies consisting of 493,776,851 people shows a mild negative correlation between the proportion of South Americans and percentage of population with hearing disability in the United States with a correlation coefficient (R) of -0.379 and weighted average of 2.7%, a difference of 4.1%.
Hearing Disability Correlation Summary
| Measurement | Immigrants from Ghana | South American |
| Minimum | 0.44% | 0.40% |
| Maximum | 7.7% | 6.4% |
| Range | 7.3% | 6.0% |
| Mean | 2.6% | 2.4% |
| Median | 2.6% | 2.4% |
| Interquartile 25% (IQ1) | 2.2% | 2.0% |
| Interquartile 75% (IQ3) | 2.8% | 2.7% |
| Interquartile Range (IQR) | 0.69% | 0.71% |
| Standard Deviation (Sample) | 1.1% | 0.75% |
| Standard Deviation (Population) | 1.1% | 0.75% |
Similar Demographics by Hearing Disability
Demographics Similar to Immigrants from Ghana by Hearing Disability
In terms of hearing disability, the demographic groups most similar to Immigrants from Ghana are Immigrants from Nigeria (2.6%, a difference of 0.25%), Immigrants from El Salvador (2.6%, a difference of 0.40%), Immigrants from Senegal (2.6%, a difference of 0.41%), Immigrants from South Central Asia (2.6%, a difference of 0.45%), and Immigrants from Sierra Leone (2.6%, a difference of 0.75%).
| Demographics | Rating | Rank | Hearing Disability |
| Immigrants | India | 99.9 /100 | #17 | Exceptional 2.5% |
| Dominicans | 99.8 /100 | #18 | Exceptional 2.5% |
| Thais | 99.8 /100 | #19 | Exceptional 2.5% |
| Immigrants | Bolivia | 99.8 /100 | #20 | Exceptional 2.5% |
| Ghanaians | 99.8 /100 | #21 | Exceptional 2.5% |
| Immigrants | Sierra Leone | 99.8 /100 | #22 | Exceptional 2.6% |
| Immigrants | Nigeria | 99.8 /100 | #23 | Exceptional 2.6% |
| Immigrants | Ghana | 99.8 /100 | #24 | Exceptional 2.6% |
| Immigrants | El Salvador | 99.7 /100 | #25 | Exceptional 2.6% |
| Immigrants | Senegal | 99.7 /100 | #26 | Exceptional 2.6% |
| Immigrants | South Central Asia | 99.7 /100 | #27 | Exceptional 2.6% |
| Immigrants | Haiti | 99.7 /100 | #28 | Exceptional 2.6% |
| Bolivians | 99.7 /100 | #29 | Exceptional 2.6% |
| Immigrants | Caribbean | 99.7 /100 | #30 | Exceptional 2.6% |
| Immigrants | Cameroon | 99.7 /100 | #31 | Exceptional 2.6% |
Demographics Similar to South Americans by Hearing Disability
In terms of hearing disability, the demographic groups most similar to South Americans are Immigrants from Nicaragua (2.7%, a difference of 0.040%), Immigrants from Ethiopia (2.7%, a difference of 0.070%), Ethiopian (2.7%, a difference of 0.13%), Immigrants from Eastern Asia (2.7%, a difference of 0.16%), and Jamaican (2.7%, a difference of 0.23%).
| Demographics | Rating | Rank | Hearing Disability |
| Paraguayans | 99.2 /100 | #50 | Exceptional 2.7% |
| Immigrants | Hong Kong | 99.2 /100 | #51 | Exceptional 2.7% |
| Jamaicans | 99.0 /100 | #52 | Exceptional 2.7% |
| Immigrants | Eastern Asia | 99.0 /100 | #53 | Exceptional 2.7% |
| Ethiopians | 99.0 /100 | #54 | Exceptional 2.7% |
| Immigrants | Ethiopia | 99.0 /100 | #55 | Exceptional 2.7% |
| Immigrants | Nicaragua | 99.0 /100 | #56 | Exceptional 2.7% |
| South Americans | 99.0 /100 | #57 | Exceptional 2.7% |
| Immigrants | Peru | 98.6 /100 | #58 | Exceptional 2.7% |
| Immigrants | Eritrea | 98.5 /100 | #59 | Exceptional 2.7% |
| Immigrants | Egypt | 98.5 /100 | #60 | Exceptional 2.7% |
| Immigrants | Uzbekistan | 98.4 /100 | #61 | Exceptional 2.7% |
| Immigrants | Colombia | 98.4 /100 | #62 | Exceptional 2.7% |
| Indians (Asian) | 98.4 /100 | #63 | Exceptional 2.7% |
| Immigrants | Sri Lanka | 98.4 /100 | #64 | Exceptional 2.7% |