Blackfeet vs Immigrants from Albania Vision Disability
COMPARE
Blackfeet
Immigrants from Albania
Vision Disability
Vision Disability Comparison
Blackfeet
Immigrants from Albania
2.6%
VISION DISABILITY
0.0/ 100
METRIC RATING
310th/ 347
METRIC RANK
2.1%
VISION DISABILITY
90.4/ 100
METRIC RATING
123rd/ 347
METRIC RANK
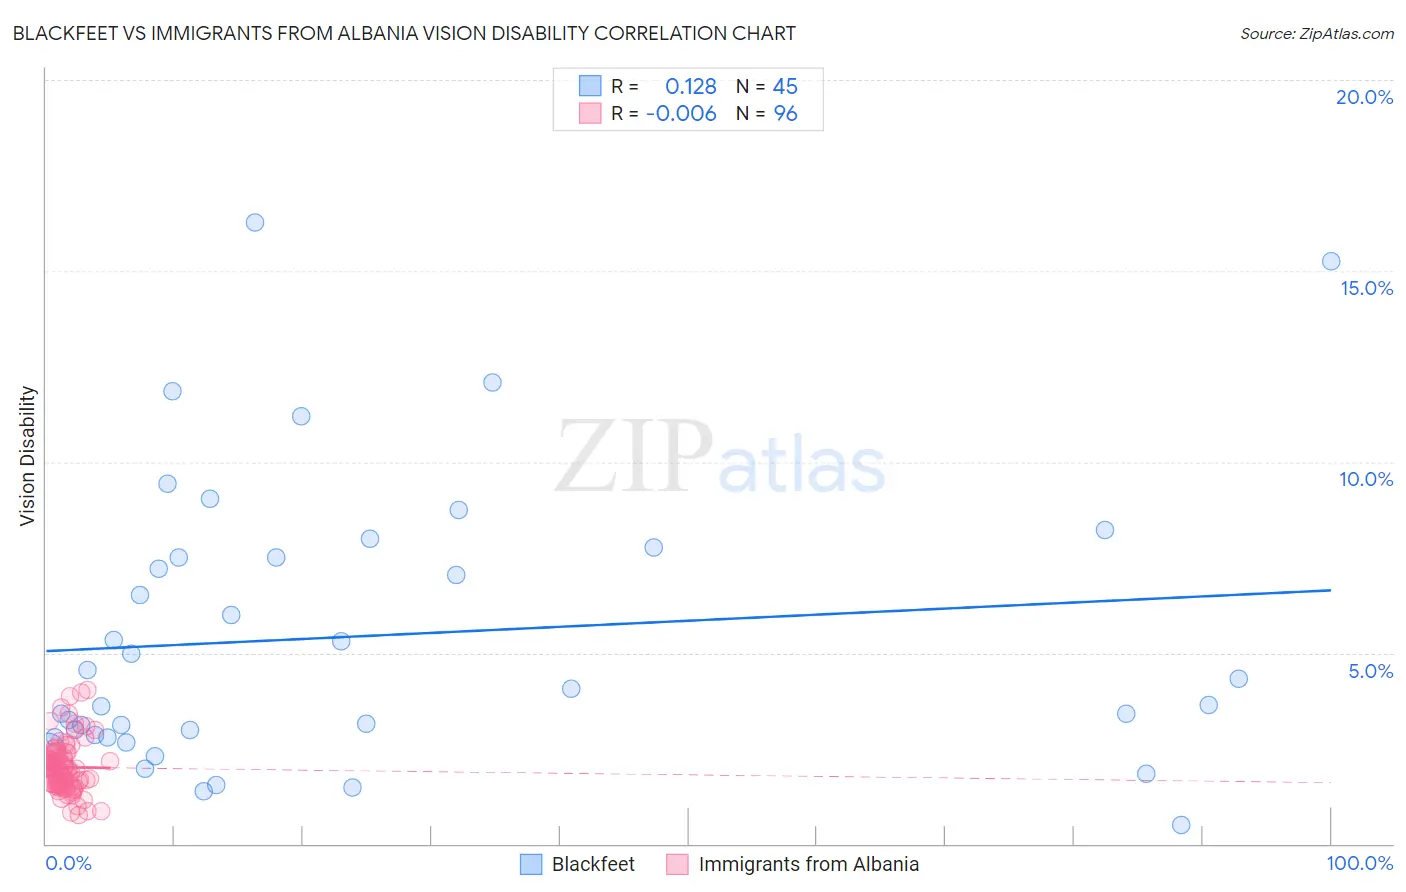
Blackfeet vs Immigrants from Albania Vision Disability Correlation Chart
The statistical analysis conducted on geographies consisting of 309,368,120 people shows a poor positive correlation between the proportion of Blackfeet and percentage of population with vision disability in the United States with a correlation coefficient (R) of 0.128 and weighted average of 2.6%. Similarly, the statistical analysis conducted on geographies consisting of 119,388,317 people shows no correlation between the proportion of Immigrants from Albania and percentage of population with vision disability in the United States with a correlation coefficient (R) of -0.006 and weighted average of 2.1%, a difference of 25.6%.
Vision Disability Correlation Summary
| Measurement | Blackfeet | Immigrants from Albania |
| Minimum | 0.51% | 0.75% |
| Maximum | 16.3% | 4.0% |
| Range | 15.8% | 3.3% |
| Mean | 5.4% | 2.0% |
| Median | 4.1% | 1.9% |
| Interquartile 25% (IQ1) | 2.8% | 1.6% |
| Interquartile 75% (IQ3) | 7.6% | 2.3% |
| Interquartile Range (IQR) | 4.8% | 0.68% |
| Standard Deviation (Sample) | 3.7% | 0.66% |
| Standard Deviation (Population) | 3.7% | 0.66% |
Similar Demographics by Vision Disability
Demographics Similar to Blackfeet by Vision Disability
In terms of vision disability, the demographic groups most similar to Blackfeet are Dominican (2.6%, a difference of 0.040%), Immigrants from Yemen (2.6%, a difference of 0.32%), Arapaho (2.6%, a difference of 0.61%), Immigrants from Dominican Republic (2.6%, a difference of 0.63%), and Iroquois (2.6%, a difference of 0.65%).
| Demographics | Rating | Rank | Vision Disability |
| Immigrants | Cabo Verde | 0.0 /100 | #303 | Tragic 2.6% |
| Aleuts | 0.0 /100 | #304 | Tragic 2.6% |
| Hispanics or Latinos | 0.0 /100 | #305 | Tragic 2.6% |
| Iroquois | 0.0 /100 | #306 | Tragic 2.6% |
| Immigrants | Dominican Republic | 0.0 /100 | #307 | Tragic 2.6% |
| Arapaho | 0.0 /100 | #308 | Tragic 2.6% |
| Immigrants | Yemen | 0.0 /100 | #309 | Tragic 2.6% |
| Blackfeet | 0.0 /100 | #310 | Tragic 2.6% |
| Dominicans | 0.0 /100 | #311 | Tragic 2.6% |
| Americans | 0.0 /100 | #312 | Tragic 2.6% |
| Potawatomi | 0.0 /100 | #313 | Tragic 2.6% |
| Inupiat | 0.0 /100 | #314 | Tragic 2.7% |
| Osage | 0.0 /100 | #315 | Tragic 2.7% |
| Shoshone | 0.0 /100 | #316 | Tragic 2.7% |
| Yup'ik | 0.0 /100 | #317 | Tragic 2.7% |
Demographics Similar to Immigrants from Albania by Vision Disability
In terms of vision disability, the demographic groups most similar to Immigrants from Albania are Immigrants from Ukraine (2.1%, a difference of 0.0%), Immigrants from Scotland (2.1%, a difference of 0.010%), Immigrants from Spain (2.1%, a difference of 0.11%), Immigrants from Venezuela (2.1%, a difference of 0.11%), and Immigrants from Zimbabwe (2.1%, a difference of 0.13%).
| Demographics | Rating | Rank | Vision Disability |
| Ugandans | 92.2 /100 | #116 | Exceptional 2.1% |
| Poles | 92.0 /100 | #117 | Exceptional 2.1% |
| Immigrants | Philippines | 91.4 /100 | #118 | Exceptional 2.1% |
| Immigrants | Uganda | 91.4 /100 | #119 | Exceptional 2.1% |
| Immigrants | Zimbabwe | 91.0 /100 | #120 | Exceptional 2.1% |
| Immigrants | Scotland | 90.4 /100 | #121 | Exceptional 2.1% |
| Immigrants | Ukraine | 90.4 /100 | #122 | Exceptional 2.1% |
| Immigrants | Albania | 90.4 /100 | #123 | Exceptional 2.1% |
| Immigrants | Spain | 89.8 /100 | #124 | Excellent 2.1% |
| Immigrants | Venezuela | 89.8 /100 | #125 | Excellent 2.1% |
| Immigrants | Peru | 89.5 /100 | #126 | Excellent 2.1% |
| Sudanese | 89.2 /100 | #127 | Excellent 2.1% |
| Immigrants | Chile | 89.0 /100 | #128 | Excellent 2.1% |
| Immigrants | Cameroon | 88.8 /100 | #129 | Excellent 2.1% |
| Immigrants | Kenya | 88.7 /100 | #130 | Excellent 2.1% |