Zimbabwean vs Ute Vision Disability
COMPARE
Zimbabwean
Ute
Vision Disability
Vision Disability Comparison
Zimbabweans
Ute
2.0%
VISION DISABILITY
99.7/ 100
METRIC RATING
39th/ 347
METRIC RANK
2.4%
VISION DISABILITY
0.1/ 100
METRIC RATING
267th/ 347
METRIC RANK
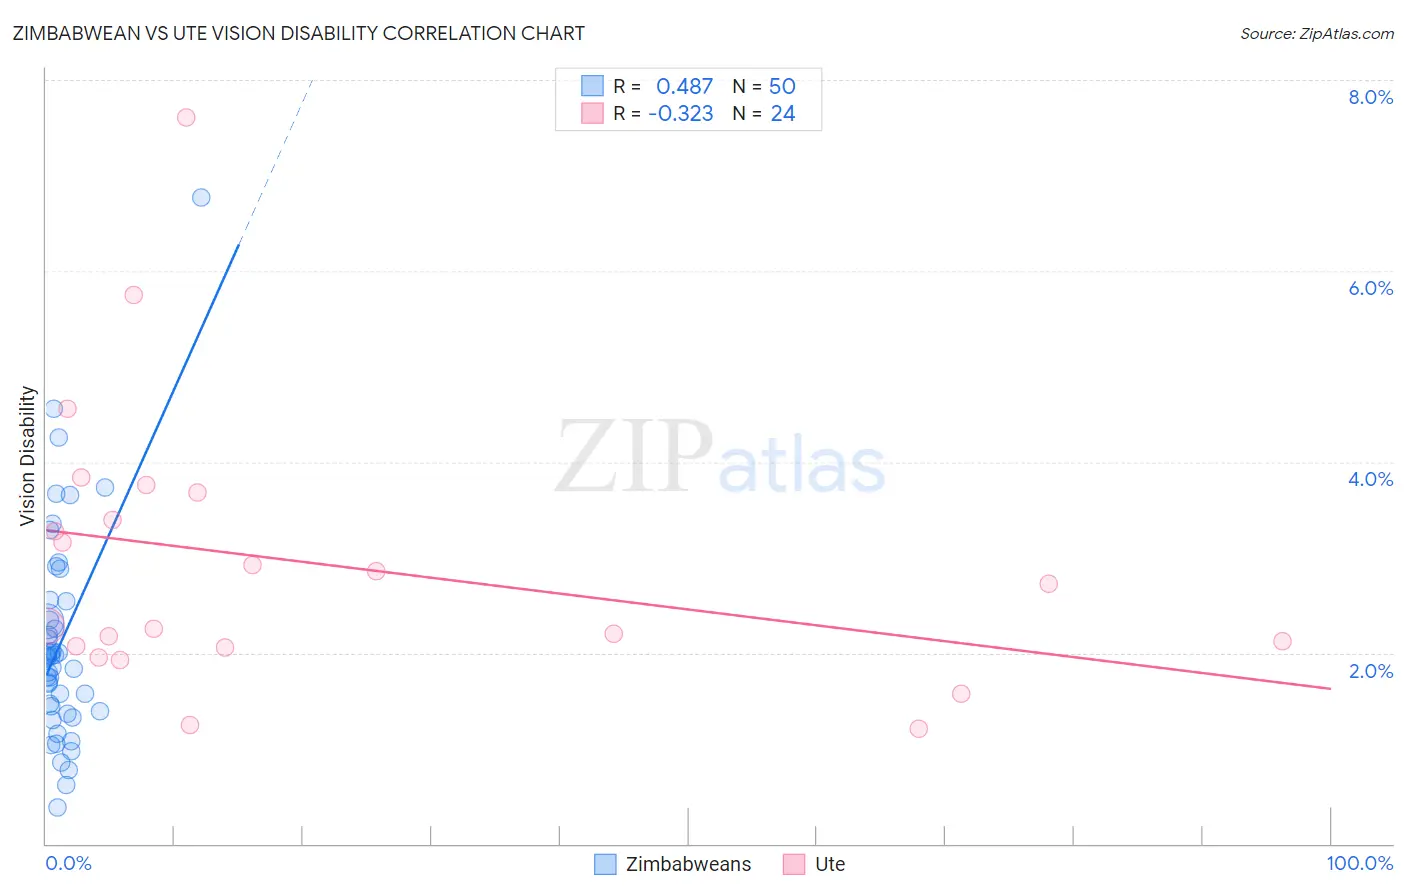
Zimbabwean vs Ute Vision Disability Correlation Chart
The statistical analysis conducted on geographies consisting of 69,201,681 people shows a moderate positive correlation between the proportion of Zimbabweans and percentage of population with vision disability in the United States with a correlation coefficient (R) of 0.487 and weighted average of 2.0%. Similarly, the statistical analysis conducted on geographies consisting of 55,653,653 people shows a mild negative correlation between the proportion of Ute and percentage of population with vision disability in the United States with a correlation coefficient (R) of -0.323 and weighted average of 2.4%, a difference of 22.3%.
Vision Disability Correlation Summary
| Measurement | Zimbabwean | Ute |
| Minimum | 0.38% | 1.2% |
| Maximum | 6.8% | 7.6% |
| Range | 6.4% | 6.4% |
| Mean | 2.1% | 2.9% |
| Median | 2.0% | 2.5% |
| Interquartile 25% (IQ1) | 1.4% | 2.1% |
| Interquartile 75% (IQ3) | 2.5% | 3.5% |
| Interquartile Range (IQR) | 1.2% | 1.5% |
| Standard Deviation (Sample) | 1.1% | 1.5% |
| Standard Deviation (Population) | 1.1% | 1.4% |
Similar Demographics by Vision Disability
Demographics Similar to Zimbabweans by Vision Disability
In terms of vision disability, the demographic groups most similar to Zimbabweans are Immigrants from Kuwait (2.0%, a difference of 0.060%), Bhutanese (2.0%, a difference of 0.090%), Immigrants from Ireland (2.0%, a difference of 0.20%), Cypriot (2.0%, a difference of 0.22%), and Cambodian (2.0%, a difference of 0.34%).
| Demographics | Rating | Rank | Vision Disability |
| Luxembourgers | 99.9 /100 | #32 | Exceptional 1.9% |
| Immigrants | Egypt | 99.9 /100 | #33 | Exceptional 1.9% |
| Immigrants | Turkey | 99.8 /100 | #34 | Exceptional 1.9% |
| Immigrants | Australia | 99.8 /100 | #35 | Exceptional 1.9% |
| Cambodians | 99.8 /100 | #36 | Exceptional 2.0% |
| Bhutanese | 99.8 /100 | #37 | Exceptional 2.0% |
| Immigrants | Kuwait | 99.8 /100 | #38 | Exceptional 2.0% |
| Zimbabweans | 99.7 /100 | #39 | Exceptional 2.0% |
| Immigrants | Ireland | 99.7 /100 | #40 | Exceptional 2.0% |
| Cypriots | 99.7 /100 | #41 | Exceptional 2.0% |
| Immigrants | Ethiopia | 99.7 /100 | #42 | Exceptional 2.0% |
| Eastern Europeans | 99.7 /100 | #43 | Exceptional 2.0% |
| Immigrants | Indonesia | 99.7 /100 | #44 | Exceptional 2.0% |
| Ethiopians | 99.7 /100 | #45 | Exceptional 2.0% |
| Immigrants | Sweden | 99.7 /100 | #46 | Exceptional 2.0% |
Demographics Similar to Ute by Vision Disability
In terms of vision disability, the demographic groups most similar to Ute are Mexican American Indian (2.4%, a difference of 0.010%), Immigrants from Jamaica (2.4%, a difference of 0.050%), Immigrants from Liberia (2.4%, a difference of 0.080%), Senegalese (2.4%, a difference of 0.090%), and Immigrants from Belize (2.4%, a difference of 0.20%).
| Demographics | Rating | Rank | Vision Disability |
| Belizeans | 0.2 /100 | #260 | Tragic 2.4% |
| Fijians | 0.1 /100 | #261 | Tragic 2.4% |
| Jamaicans | 0.1 /100 | #262 | Tragic 2.4% |
| Immigrants | Belize | 0.1 /100 | #263 | Tragic 2.4% |
| Immigrants | Liberia | 0.1 /100 | #264 | Tragic 2.4% |
| Immigrants | Jamaica | 0.1 /100 | #265 | Tragic 2.4% |
| Mexican American Indians | 0.1 /100 | #266 | Tragic 2.4% |
| Ute | 0.1 /100 | #267 | Tragic 2.4% |
| Senegalese | 0.1 /100 | #268 | Tragic 2.4% |
| Celtics | 0.1 /100 | #269 | Tragic 2.4% |
| Cubans | 0.1 /100 | #270 | Tragic 2.4% |
| Immigrants | Azores | 0.1 /100 | #271 | Tragic 2.4% |
| Spaniards | 0.1 /100 | #272 | Tragic 2.4% |
| Immigrants | Bahamas | 0.1 /100 | #273 | Tragic 2.4% |
| Immigrants | Latin America | 0.0 /100 | #274 | Tragic 2.4% |