Bermudan vs Immigrants from Costa Rica Single Mother Poverty
COMPARE
Bermudan
Immigrants from Costa Rica
Single Mother Poverty
Single Mother Poverty Comparison
Bermudans
Immigrants from Costa Rica
30.6%
SINGLE MOTHER POVERTY
1.6/ 100
METRIC RATING
243rd/ 347
METRIC RANK
29.2%
SINGLE MOTHER POVERTY
48.8/ 100
METRIC RATING
175th/ 347
METRIC RANK
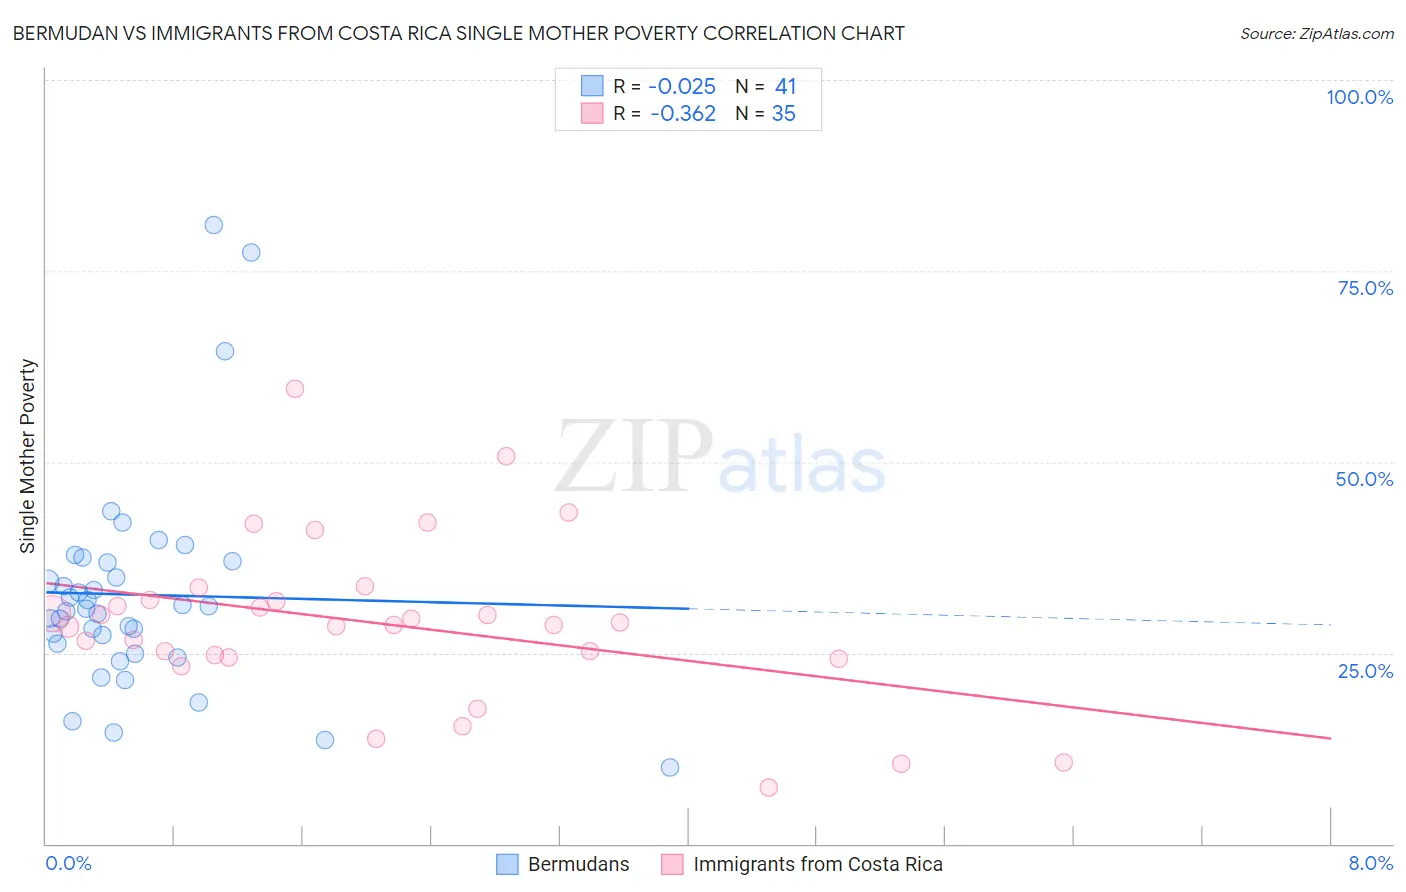
Bermudan vs Immigrants from Costa Rica Single Mother Poverty Correlation Chart
The statistical analysis conducted on geographies consisting of 55,530,173 people shows no correlation between the proportion of Bermudans and poverty level among single mothers in the United States with a correlation coefficient (R) of -0.025 and weighted average of 30.6%. Similarly, the statistical analysis conducted on geographies consisting of 201,853,428 people shows a mild negative correlation between the proportion of Immigrants from Costa Rica and poverty level among single mothers in the United States with a correlation coefficient (R) of -0.362 and weighted average of 29.2%, a difference of 4.9%.
Single Mother Poverty Correlation Summary
| Measurement | Bermudan | Immigrants from Costa Rica |
| Minimum | 10.0% | 7.4% |
| Maximum | 81.0% | 59.6% |
| Range | 71.0% | 52.2% |
| Mean | 32.6% | 28.9% |
| Median | 30.7% | 28.6% |
| Interquartile 25% (IQ1) | 25.5% | 24.4% |
| Interquartile 75% (IQ3) | 36.9% | 31.9% |
| Interquartile Range (IQR) | 11.3% | 7.4% |
| Standard Deviation (Sample) | 14.2% | 10.9% |
| Standard Deviation (Population) | 14.0% | 10.7% |
Similar Demographics by Single Mother Poverty
Demographics Similar to Bermudans by Single Mother Poverty
In terms of single mother poverty, the demographic groups most similar to Bermudans are Immigrants from Burma/Myanmar (30.6%, a difference of 0.080%), Immigrants from Laos (30.6%, a difference of 0.10%), Salvadoran (30.6%, a difference of 0.15%), French (30.7%, a difference of 0.22%), and Barbadian (30.7%, a difference of 0.23%).
| Demographics | Rating | Rank | Single Mother Poverty |
| Welsh | 3.2 /100 | #236 | Tragic 30.4% |
| Immigrants | St. Vincent and the Grenadines | 3.1 /100 | #237 | Tragic 30.4% |
| Slovaks | 2.8 /100 | #238 | Tragic 30.4% |
| Immigrants | Portugal | 2.1 /100 | #239 | Tragic 30.5% |
| Salvadorans | 1.8 /100 | #240 | Tragic 30.6% |
| Immigrants | Laos | 1.8 /100 | #241 | Tragic 30.6% |
| Immigrants | Burma/Myanmar | 1.7 /100 | #242 | Tragic 30.6% |
| Bermudans | 1.6 /100 | #243 | Tragic 30.6% |
| French | 1.3 /100 | #244 | Tragic 30.7% |
| Barbadians | 1.3 /100 | #245 | Tragic 30.7% |
| Ecuadorians | 0.9 /100 | #246 | Tragic 30.8% |
| West Indians | 0.9 /100 | #247 | Tragic 30.8% |
| French Canadians | 0.9 /100 | #248 | Tragic 30.8% |
| Cape Verdeans | 0.8 /100 | #249 | Tragic 30.8% |
| Vietnamese | 0.7 /100 | #250 | Tragic 30.9% |
Demographics Similar to Immigrants from Costa Rica by Single Mother Poverty
In terms of single mother poverty, the demographic groups most similar to Immigrants from Costa Rica are Hawaiian (29.2%, a difference of 0.040%), Immigrants from Saudi Arabia (29.2%, a difference of 0.060%), British (29.2%, a difference of 0.090%), Immigrants from Bosnia and Herzegovina (29.2%, a difference of 0.17%), and Carpatho Rusyn (29.1%, a difference of 0.24%).
| Demographics | Rating | Rank | Single Mother Poverty |
| Europeans | 57.6 /100 | #168 | Average 29.1% |
| Immigrants | Uruguay | 57.2 /100 | #169 | Average 29.1% |
| New Zealanders | 55.1 /100 | #170 | Average 29.1% |
| Puget Sound Salish | 55.1 /100 | #171 | Average 29.1% |
| Carpatho Rusyns | 53.8 /100 | #172 | Average 29.1% |
| British | 50.6 /100 | #173 | Average 29.2% |
| Immigrants | Saudi Arabia | 50.0 /100 | #174 | Average 29.2% |
| Immigrants | Costa Rica | 48.8 /100 | #175 | Average 29.2% |
| Hawaiians | 47.8 /100 | #176 | Average 29.2% |
| Immigrants | Bosnia and Herzegovina | 45.1 /100 | #177 | Average 29.2% |
| South American Indians | 43.2 /100 | #178 | Average 29.3% |
| Immigrants | Uzbekistan | 42.6 /100 | #179 | Average 29.3% |
| Immigrants | Norway | 41.5 /100 | #180 | Average 29.3% |
| Canadians | 40.4 /100 | #181 | Average 29.3% |
| Immigrants | Eastern Africa | 38.5 /100 | #182 | Fair 29.3% |