Belizean vs Carpatho Rusyn Unemployment Among Ages 60 to 64 years
COMPARE
Belizean
Carpatho Rusyn
Unemployment Among Ages 60 to 64 years
Unemployment Among Ages 60 to 64 years Comparison
Belizeans
Carpatho Rusyns
5.5%
UNEMPLOYMENT AMONG AGES 60 TO 64 YEARS
0.0/ 100
METRIC RATING
313th/ 347
METRIC RANK
4.5%
UNEMPLOYMENT AMONG AGES 60 TO 64 YEARS
100.0/ 100
METRIC RATING
33rd/ 347
METRIC RANK
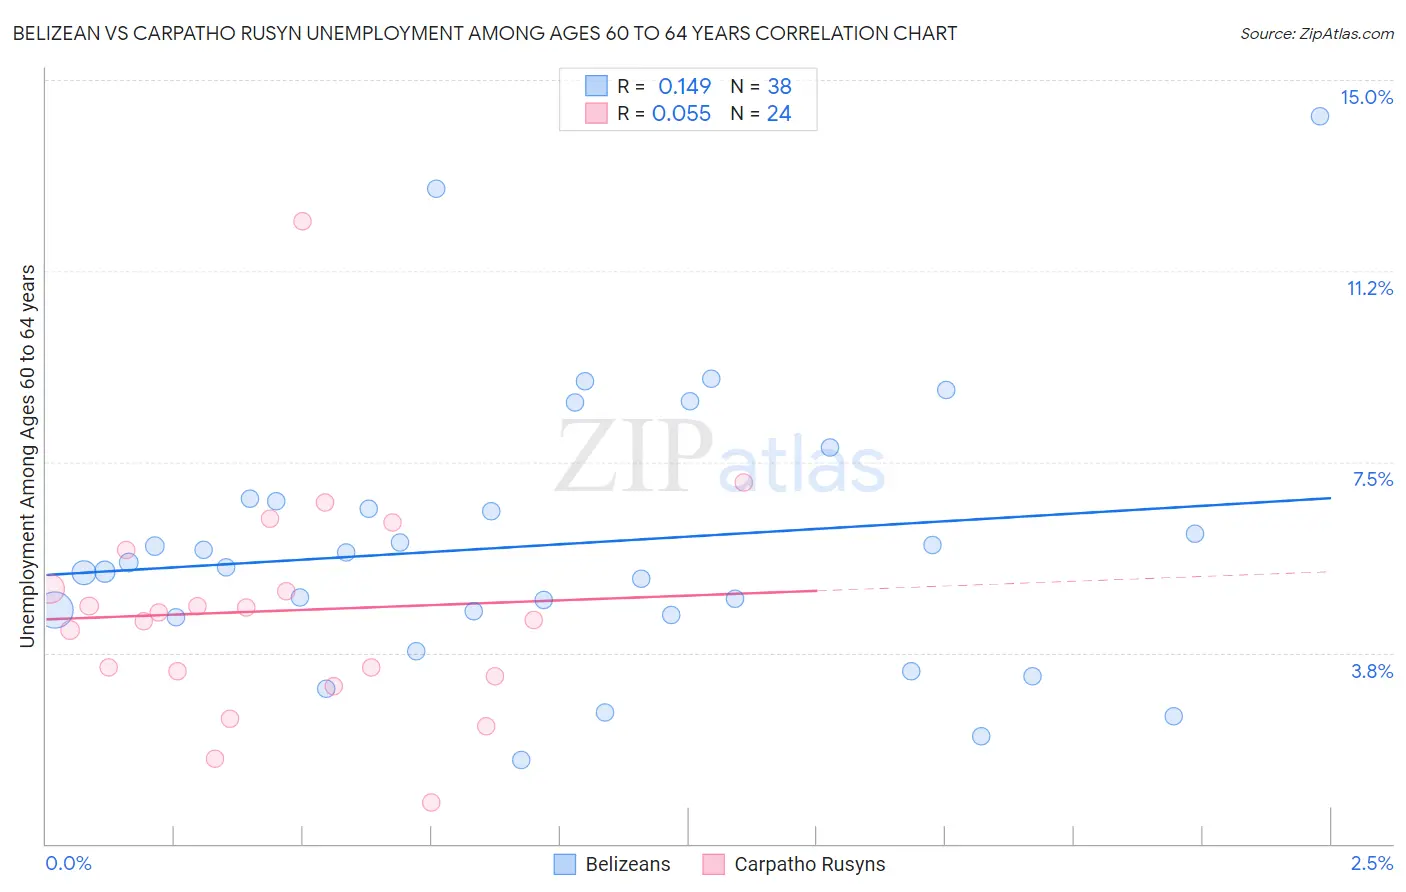
Belizean vs Carpatho Rusyn Unemployment Among Ages 60 to 64 years Correlation Chart
The statistical analysis conducted on geographies consisting of 139,664,950 people shows a poor positive correlation between the proportion of Belizeans and unemployment rate among population between the ages 60 and 64 in the United States with a correlation coefficient (R) of 0.149 and weighted average of 5.5%. Similarly, the statistical analysis conducted on geographies consisting of 57,468,302 people shows a slight positive correlation between the proportion of Carpatho Rusyns and unemployment rate among population between the ages 60 and 64 in the United States with a correlation coefficient (R) of 0.055 and weighted average of 4.5%, a difference of 23.1%.
Unemployment Among Ages 60 to 64 years Correlation Summary
| Measurement | Belizean | Carpatho Rusyn |
| Minimum | 1.6% | 0.80% |
| Maximum | 14.3% | 12.2% |
| Range | 12.7% | 11.4% |
| Mean | 5.9% | 4.6% |
| Median | 5.5% | 4.5% |
| Interquartile 25% (IQ1) | 4.5% | 3.3% |
| Interquartile 75% (IQ3) | 6.7% | 5.4% |
| Interquartile Range (IQR) | 2.2% | 2.0% |
| Standard Deviation (Sample) | 2.7% | 2.3% |
| Standard Deviation (Population) | 2.6% | 2.2% |
Similar Demographics by Unemployment Among Ages 60 to 64 years
Demographics Similar to Belizeans by Unemployment Among Ages 60 to 64 years
In terms of unemployment among ages 60 to 64 years, the demographic groups most similar to Belizeans are Guyanese (5.5%, a difference of 0.17%), Immigrants from West Indies (5.5%, a difference of 0.70%), U.S. Virgin Islander (5.5%, a difference of 0.89%), British West Indian (5.5%, a difference of 0.90%), and Cree (5.6%, a difference of 1.5%).
| Demographics | Rating | Rank | Unemployment Among Ages 60 to 64 years |
| Immigrants | Dominica | 0.0 /100 | #306 | Tragic 5.4% |
| Immigrants | Guyana | 0.0 /100 | #307 | Tragic 5.4% |
| Spanish American Indians | 0.0 /100 | #308 | Tragic 5.4% |
| Soviet Union | 0.0 /100 | #309 | Tragic 5.4% |
| British West Indians | 0.0 /100 | #310 | Tragic 5.5% |
| U.S. Virgin Islanders | 0.0 /100 | #311 | Tragic 5.5% |
| Immigrants | West Indies | 0.0 /100 | #312 | Tragic 5.5% |
| Belizeans | 0.0 /100 | #313 | Tragic 5.5% |
| Guyanese | 0.0 /100 | #314 | Tragic 5.5% |
| Cree | 0.0 /100 | #315 | Tragic 5.6% |
| Cheyenne | 0.0 /100 | #316 | Tragic 5.6% |
| Shoshone | 0.0 /100 | #317 | Tragic 5.7% |
| Natives/Alaskans | 0.0 /100 | #318 | Tragic 5.7% |
| Immigrants | Belize | 0.0 /100 | #319 | Tragic 5.7% |
| Colville | 0.0 /100 | #320 | Tragic 5.7% |
Demographics Similar to Carpatho Rusyns by Unemployment Among Ages 60 to 64 years
In terms of unemployment among ages 60 to 64 years, the demographic groups most similar to Carpatho Rusyns are Zimbabwean (4.5%, a difference of 0.050%), Immigrants from Eritrea (4.5%, a difference of 0.090%), Immigrants from Venezuela (4.5%, a difference of 0.16%), Cuban (4.5%, a difference of 0.18%), and Belgian (4.5%, a difference of 0.26%).
| Demographics | Rating | Rank | Unemployment Among Ages 60 to 64 years |
| Czechs | 100.0 /100 | #26 | Exceptional 4.4% |
| Immigrants | Iraq | 100.0 /100 | #27 | Exceptional 4.5% |
| Immigrants | Nepal | 100.0 /100 | #28 | Exceptional 4.5% |
| Cubans | 100.0 /100 | #29 | Exceptional 4.5% |
| Immigrants | Venezuela | 100.0 /100 | #30 | Exceptional 4.5% |
| Immigrants | Eritrea | 100.0 /100 | #31 | Exceptional 4.5% |
| Zimbabweans | 100.0 /100 | #32 | Exceptional 4.5% |
| Carpatho Rusyns | 100.0 /100 | #33 | Exceptional 4.5% |
| Belgians | 100.0 /100 | #34 | Exceptional 4.5% |
| Germans | 100.0 /100 | #35 | Exceptional 4.5% |
| Venezuelans | 100.0 /100 | #36 | Exceptional 4.5% |
| Immigrants | Portugal | 100.0 /100 | #37 | Exceptional 4.5% |
| Native Hawaiians | 100.0 /100 | #38 | Exceptional 4.5% |
| Iraqis | 100.0 /100 | #39 | Exceptional 4.5% |
| Scandinavians | 100.0 /100 | #40 | Exceptional 4.5% |