Belgian vs Yaqui In Labor Force | Age 20-24
COMPARE
Belgian
Yaqui
In Labor Force | Age 20-24
In Labor Force | Age 20-24 Comparison
Belgians
Yaqui
77.8%
IN LABOR FORCE | AGE 20-24
100.0/ 100
METRIC RATING
28th/ 347
METRIC RANK
75.5%
IN LABOR FORCE | AGE 20-24
85.5/ 100
METRIC RATING
135th/ 347
METRIC RANK
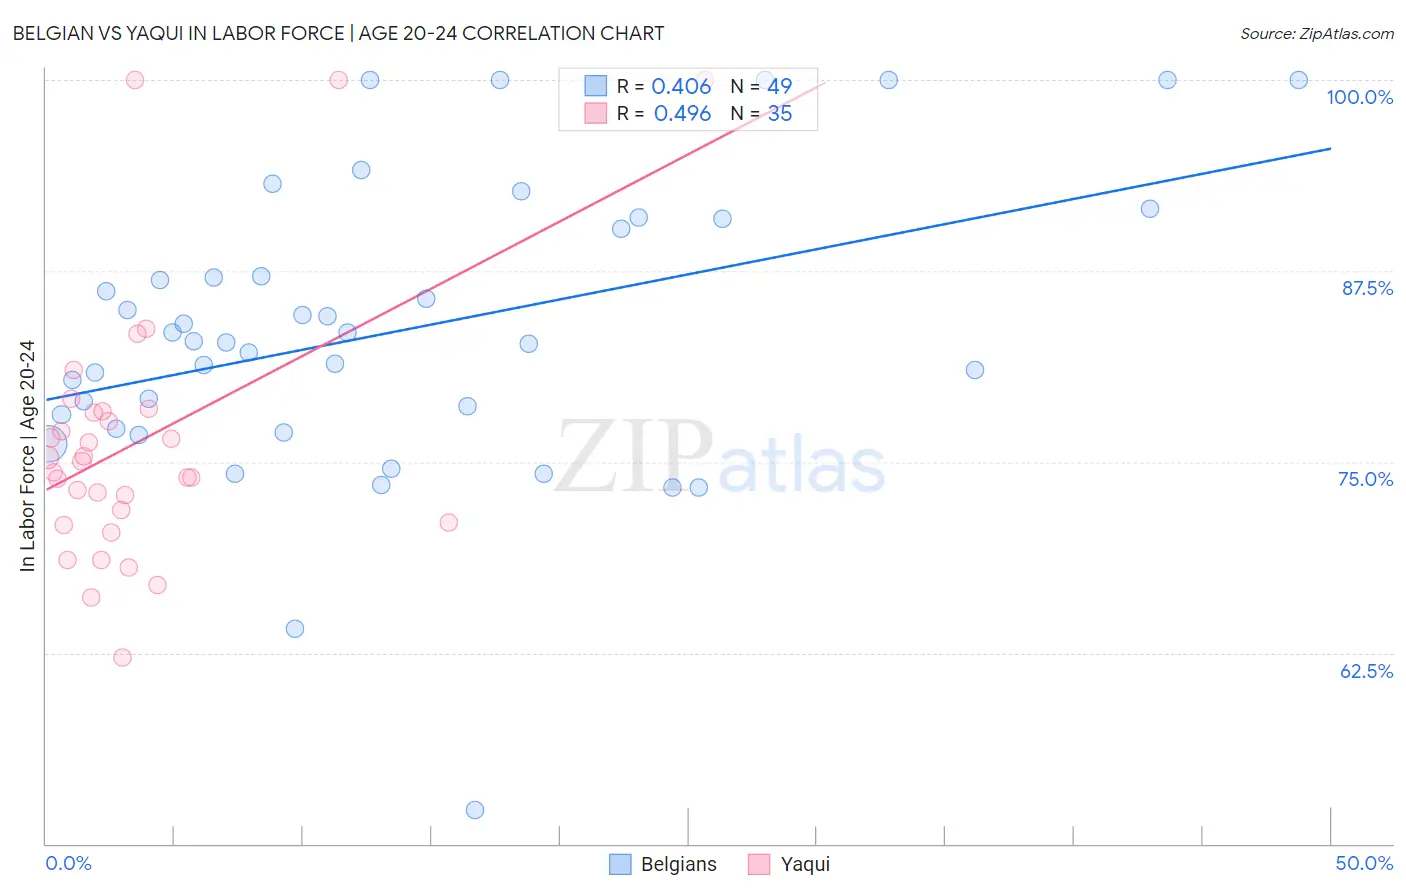
Belgian vs Yaqui In Labor Force | Age 20-24 Correlation Chart
The statistical analysis conducted on geographies consisting of 355,814,007 people shows a moderate positive correlation between the proportion of Belgians and labor force participation rate among population between the ages 20 and 24 in the United States with a correlation coefficient (R) of 0.406 and weighted average of 77.8%. Similarly, the statistical analysis conducted on geographies consisting of 107,696,934 people shows a moderate positive correlation between the proportion of Yaqui and labor force participation rate among population between the ages 20 and 24 in the United States with a correlation coefficient (R) of 0.496 and weighted average of 75.5%, a difference of 3.0%.
In Labor Force | Age 20-24 Correlation Summary
| Measurement | Belgian | Yaqui |
| Minimum | 52.2% | 62.2% |
| Maximum | 100.0% | 100.0% |
| Range | 47.8% | 37.8% |
| Mean | 83.6% | 76.3% |
| Median | 82.9% | 75.1% |
| Interquartile 25% (IQ1) | 77.6% | 71.0% |
| Interquartile 75% (IQ3) | 90.6% | 78.3% |
| Interquartile Range (IQR) | 13.0% | 7.3% |
| Standard Deviation (Sample) | 9.6% | 8.7% |
| Standard Deviation (Population) | 9.5% | 8.6% |
Similar Demographics by In Labor Force | Age 20-24
Demographics Similar to Belgians by In Labor Force | Age 20-24
In terms of in labor force | age 20-24, the demographic groups most similar to Belgians are Immigrants from Micronesia (77.8%, a difference of 0.040%), Slovak (77.7%, a difference of 0.090%), Swiss (77.7%, a difference of 0.10%), Tongan (77.9%, a difference of 0.16%), and Tlingit-Haida (77.9%, a difference of 0.18%).
| Demographics | Rating | Rank | In Labor Force | Age 20-24 |
| Puget Sound Salish | 100.0 /100 | #21 | Exceptional 78.0% |
| Pennsylvania Germans | 100.0 /100 | #22 | Exceptional 78.0% |
| Yugoslavians | 100.0 /100 | #23 | Exceptional 78.0% |
| Liberians | 100.0 /100 | #24 | Exceptional 78.0% |
| Tlingit-Haida | 100.0 /100 | #25 | Exceptional 77.9% |
| Tongans | 100.0 /100 | #26 | Exceptional 77.9% |
| Immigrants | Micronesia | 100.0 /100 | #27 | Exceptional 77.8% |
| Belgians | 100.0 /100 | #28 | Exceptional 77.8% |
| Slovaks | 100.0 /100 | #29 | Exceptional 77.7% |
| Swiss | 100.0 /100 | #30 | Exceptional 77.7% |
| Poles | 100.0 /100 | #31 | Exceptional 77.6% |
| English | 100.0 /100 | #32 | Exceptional 77.6% |
| Immigrants | Ethiopia | 100.0 /100 | #33 | Exceptional 77.5% |
| German Russians | 100.0 /100 | #34 | Exceptional 77.5% |
| Immigrants | Eastern Africa | 100.0 /100 | #35 | Exceptional 77.5% |
Demographics Similar to Yaqui by In Labor Force | Age 20-24
In terms of in labor force | age 20-24, the demographic groups most similar to Yaqui are Immigrants from Brazil (75.5%, a difference of 0.020%), Jordanian (75.5%, a difference of 0.020%), Australian (75.5%, a difference of 0.020%), Immigrants from England (75.5%, a difference of 0.030%), and Delaware (75.5%, a difference of 0.030%).
| Demographics | Rating | Rank | In Labor Force | Age 20-24 |
| Immigrants | Afghanistan | 89.4 /100 | #128 | Excellent 75.6% |
| Iroquois | 89.1 /100 | #129 | Excellent 75.6% |
| Immigrants | Austria | 88.8 /100 | #130 | Excellent 75.6% |
| Immigrants | Jordan | 88.5 /100 | #131 | Excellent 75.6% |
| Palestinians | 88.4 /100 | #132 | Excellent 75.6% |
| Zimbabweans | 88.2 /100 | #133 | Excellent 75.6% |
| Estonians | 87.1 /100 | #134 | Excellent 75.6% |
| Yaqui | 85.5 /100 | #135 | Excellent 75.5% |
| Immigrants | Brazil | 84.8 /100 | #136 | Excellent 75.5% |
| Jordanians | 84.8 /100 | #137 | Excellent 75.5% |
| Australians | 84.8 /100 | #138 | Excellent 75.5% |
| Immigrants | England | 84.6 /100 | #139 | Excellent 75.5% |
| Delaware | 84.5 /100 | #140 | Excellent 75.5% |
| Romanians | 84.1 /100 | #141 | Excellent 75.5% |
| Blackfeet | 83.6 /100 | #142 | Excellent 75.5% |