Basque vs Tlingit-Haida Disability Age 65 to 74
COMPARE
Basque
Tlingit-Haida
Disability Age 65 to 74
Disability Age 65 to 74 Comparison
Basques
Tlingit-Haida
23.5%
DISABILITY AGE 65 TO 74
38.4/ 100
METRIC RATING
186th/ 347
METRIC RANK
27.1%
DISABILITY AGE 65 TO 74
0.0/ 100
METRIC RATING
303rd/ 347
METRIC RANK
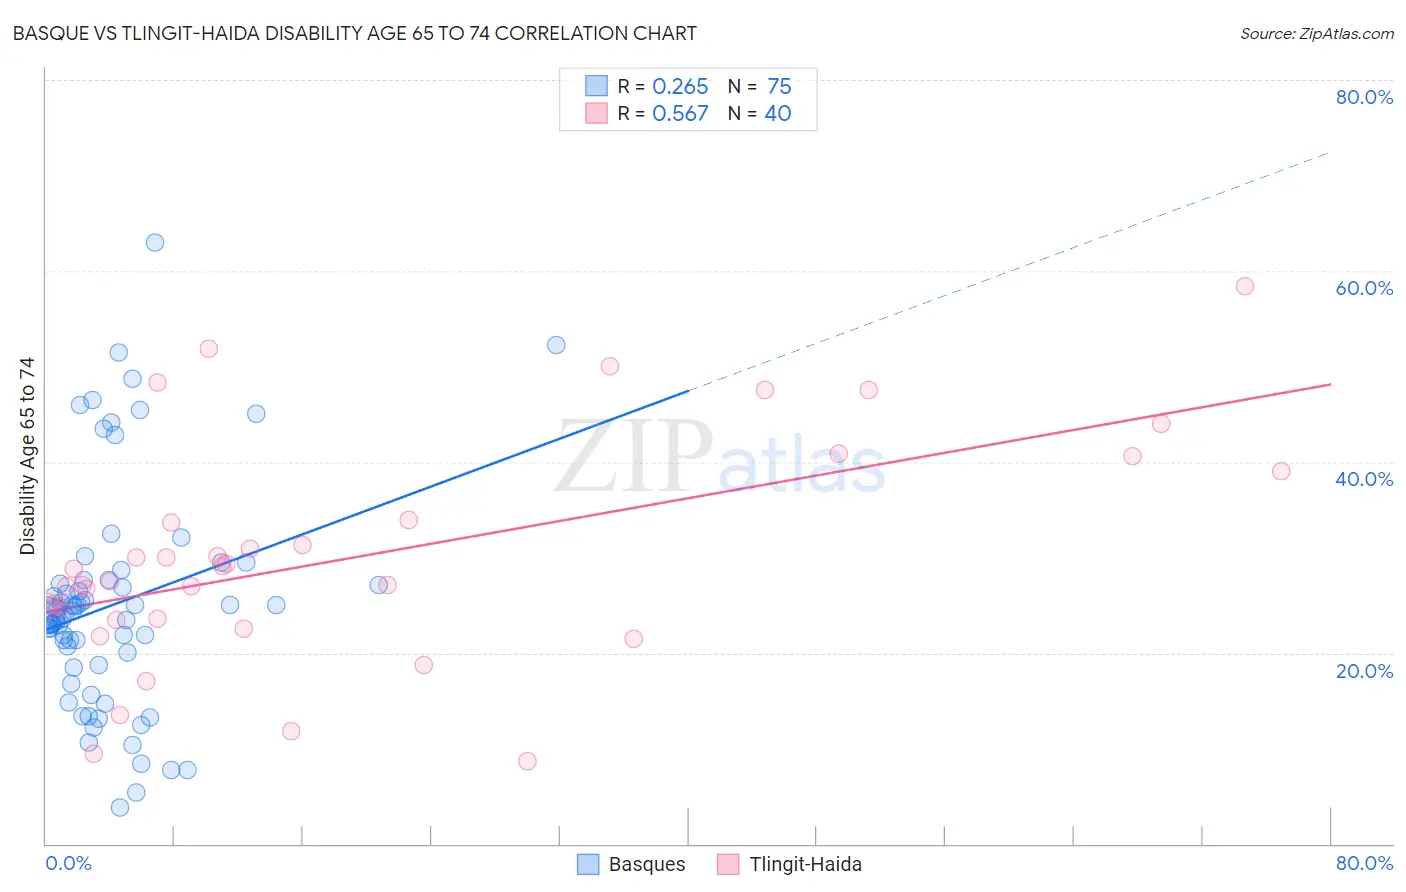
Basque vs Tlingit-Haida Disability Age 65 to 74 Correlation Chart
The statistical analysis conducted on geographies consisting of 165,654,682 people shows a weak positive correlation between the proportion of Basques and percentage of population with a disability between the ages 65 and 75 in the United States with a correlation coefficient (R) of 0.265 and weighted average of 23.5%. Similarly, the statistical analysis conducted on geographies consisting of 60,808,898 people shows a substantial positive correlation between the proportion of Tlingit-Haida and percentage of population with a disability between the ages 65 and 75 in the United States with a correlation coefficient (R) of 0.567 and weighted average of 27.1%, a difference of 15.4%.
Disability Age 65 to 74 Correlation Summary
| Measurement | Basque | Tlingit-Haida |
| Minimum | 3.8% | 8.6% |
| Maximum | 63.0% | 58.3% |
| Range | 59.1% | 49.7% |
| Mean | 25.1% | 30.1% |
| Median | 24.0% | 28.2% |
| Interquartile 25% (IQ1) | 18.7% | 23.5% |
| Interquartile 75% (IQ3) | 27.6% | 36.5% |
| Interquartile Range (IQR) | 8.8% | 12.9% |
| Standard Deviation (Sample) | 11.6% | 11.7% |
| Standard Deviation (Population) | 11.6% | 11.6% |
Similar Demographics by Disability Age 65 to 74
Demographics Similar to Basques by Disability Age 65 to 74
In terms of disability age 65 to 74, the demographic groups most similar to Basques are Portuguese (23.5%, a difference of 0.040%), Haitian (23.4%, a difference of 0.24%), Immigrants from Germany (23.4%, a difference of 0.25%), Immigrants from Eastern Africa (23.4%, a difference of 0.27%), and Immigrants from Cuba (23.6%, a difference of 0.27%).
| Demographics | Rating | Rank | Disability Age 65 to 74 |
| Immigrants | Sierra Leone | 45.8 /100 | #179 | Average 23.4% |
| Scandinavians | 45.6 /100 | #180 | Average 23.4% |
| Assyrians/Chaldeans/Syriacs | 45.3 /100 | #181 | Average 23.4% |
| Irish | 44.4 /100 | #182 | Average 23.4% |
| Immigrants | Eastern Africa | 42.8 /100 | #183 | Average 23.4% |
| Immigrants | Germany | 42.5 /100 | #184 | Average 23.4% |
| Haitians | 42.4 /100 | #185 | Average 23.4% |
| Basques | 38.4 /100 | #186 | Fair 23.5% |
| Portuguese | 37.8 /100 | #187 | Fair 23.5% |
| Immigrants | Cuba | 34.0 /100 | #188 | Fair 23.6% |
| Scottish | 33.1 /100 | #189 | Fair 23.6% |
| Immigrants | Guyana | 31.2 /100 | #190 | Fair 23.6% |
| Immigrants | Bangladesh | 30.2 /100 | #191 | Fair 23.6% |
| Ecuadorians | 29.7 /100 | #192 | Fair 23.6% |
| English | 28.5 /100 | #193 | Fair 23.6% |
Demographics Similar to Tlingit-Haida by Disability Age 65 to 74
In terms of disability age 65 to 74, the demographic groups most similar to Tlingit-Haida are Central American Indian (27.1%, a difference of 0.060%), Immigrants from Mexico (27.1%, a difference of 0.070%), Puget Sound Salish (27.2%, a difference of 0.12%), Mexican (27.2%, a difference of 0.22%), and Immigrants from Dominican Republic (27.0%, a difference of 0.39%).
| Demographics | Rating | Rank | Disability Age 65 to 74 |
| Bangladeshis | 0.0 /100 | #296 | Tragic 26.8% |
| Fijians | 0.0 /100 | #297 | Tragic 27.0% |
| Immigrants | Yemen | 0.0 /100 | #298 | Tragic 27.0% |
| Potawatomi | 0.0 /100 | #299 | Tragic 27.0% |
| Immigrants | Dominican Republic | 0.0 /100 | #300 | Tragic 27.0% |
| Immigrants | Mexico | 0.0 /100 | #301 | Tragic 27.1% |
| Central American Indians | 0.0 /100 | #302 | Tragic 27.1% |
| Tlingit-Haida | 0.0 /100 | #303 | Tragic 27.1% |
| Puget Sound Salish | 0.0 /100 | #304 | Tragic 27.2% |
| Mexicans | 0.0 /100 | #305 | Tragic 27.2% |
| Blacks/African Americans | 0.0 /100 | #306 | Tragic 27.3% |
| Ute | 0.0 /100 | #307 | Tragic 27.3% |
| Sioux | 0.0 /100 | #308 | Tragic 27.3% |
| Yaqui | 0.0 /100 | #309 | Tragic 27.4% |
| Shoshone | 0.0 /100 | #310 | Tragic 27.4% |