Hopi vs Tlingit-Haida Disability Age 65 to 74
COMPARE
Hopi
Tlingit-Haida
Disability Age 65 to 74
Disability Age 65 to 74 Comparison
Hopi
Tlingit-Haida
30.0%
DISABILITY AGE 65 TO 74
0.0/ 100
METRIC RATING
328th/ 347
METRIC RANK
27.1%
DISABILITY AGE 65 TO 74
0.0/ 100
METRIC RATING
303rd/ 347
METRIC RANK
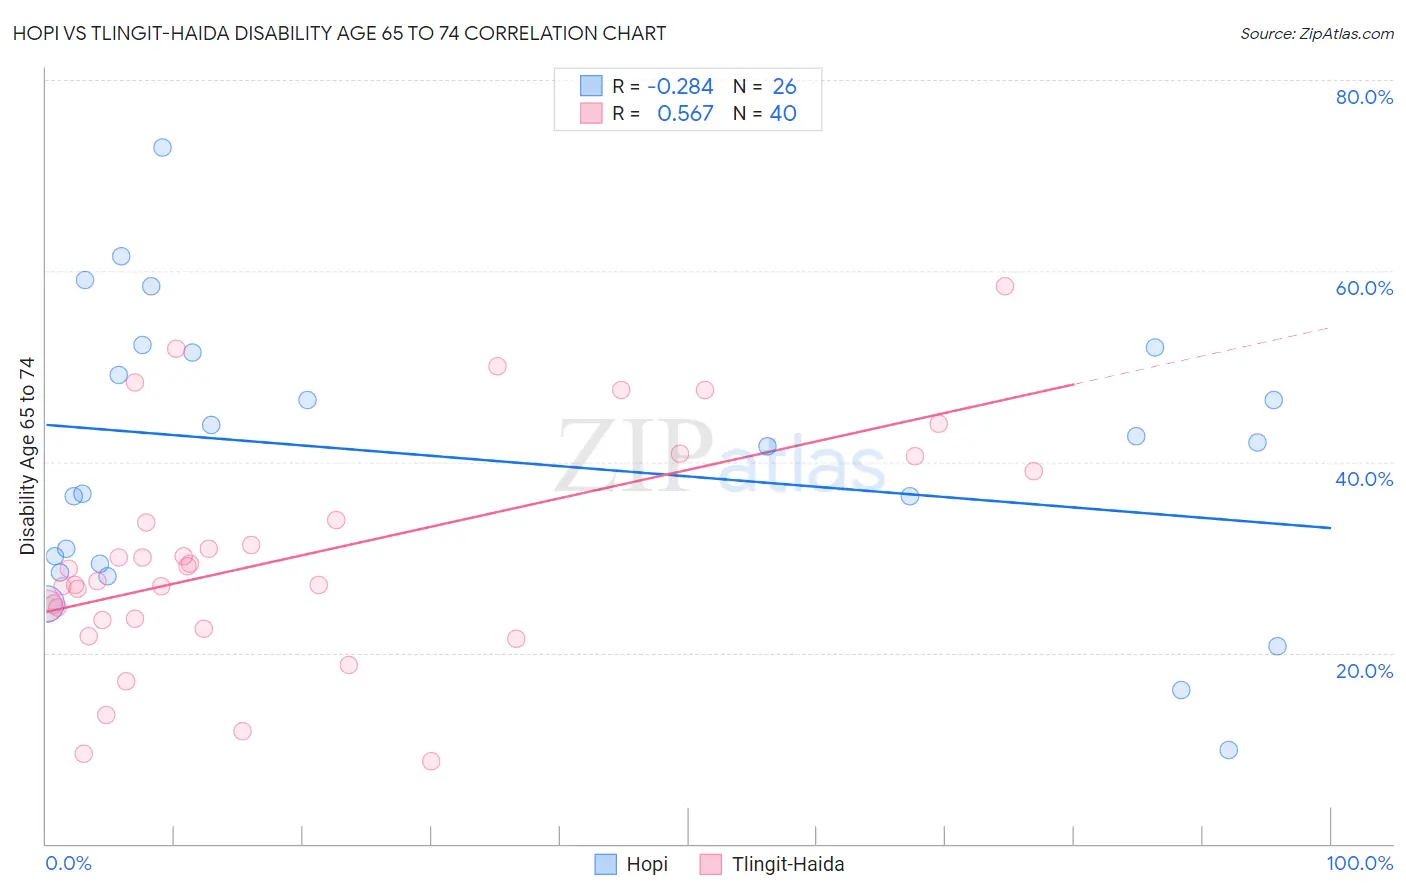
Hopi vs Tlingit-Haida Disability Age 65 to 74 Correlation Chart
The statistical analysis conducted on geographies consisting of 74,641,901 people shows a weak negative correlation between the proportion of Hopi and percentage of population with a disability between the ages 65 and 75 in the United States with a correlation coefficient (R) of -0.284 and weighted average of 30.0%. Similarly, the statistical analysis conducted on geographies consisting of 60,808,898 people shows a substantial positive correlation between the proportion of Tlingit-Haida and percentage of population with a disability between the ages 65 and 75 in the United States with a correlation coefficient (R) of 0.567 and weighted average of 27.1%, a difference of 10.4%.
Disability Age 65 to 74 Correlation Summary
| Measurement | Hopi | Tlingit-Haida |
| Minimum | 9.9% | 8.6% |
| Maximum | 72.9% | 58.3% |
| Range | 63.1% | 49.7% |
| Mean | 40.3% | 30.1% |
| Median | 41.8% | 28.2% |
| Interquartile 25% (IQ1) | 29.4% | 23.5% |
| Interquartile 75% (IQ3) | 51.5% | 36.5% |
| Interquartile Range (IQR) | 22.1% | 12.9% |
| Standard Deviation (Sample) | 14.9% | 11.7% |
| Standard Deviation (Population) | 14.6% | 11.6% |
Similar Demographics by Disability Age 65 to 74
Demographics Similar to Hopi by Disability Age 65 to 74
In terms of disability age 65 to 74, the demographic groups most similar to Hopi are Choctaw (30.2%, a difference of 0.80%), Creek (30.2%, a difference of 0.83%), Chickasaw (30.2%, a difference of 0.84%), Apache (29.7%, a difference of 0.94%), and Yakama (29.6%, a difference of 1.1%).
| Demographics | Rating | Rank | Disability Age 65 to 74 |
| Comanche | 0.0 /100 | #321 | Tragic 28.3% |
| Aleuts | 0.0 /100 | #322 | Tragic 28.4% |
| Puerto Ricans | 0.0 /100 | #323 | Tragic 29.1% |
| Seminole | 0.0 /100 | #324 | Tragic 29.4% |
| Dutch West Indians | 0.0 /100 | #325 | Tragic 29.6% |
| Yakama | 0.0 /100 | #326 | Tragic 29.6% |
| Apache | 0.0 /100 | #327 | Tragic 29.7% |
| Hopi | 0.0 /100 | #328 | Tragic 30.0% |
| Choctaw | 0.0 /100 | #329 | Tragic 30.2% |
| Creek | 0.0 /100 | #330 | Tragic 30.2% |
| Chickasaw | 0.0 /100 | #331 | Tragic 30.2% |
| Natives/Alaskans | 0.0 /100 | #332 | Tragic 30.4% |
| Colville | 0.0 /100 | #333 | Tragic 30.5% |
| Alaska Natives | 0.0 /100 | #334 | Tragic 30.6% |
| Cheyenne | 0.0 /100 | #335 | Tragic 31.1% |
Demographics Similar to Tlingit-Haida by Disability Age 65 to 74
In terms of disability age 65 to 74, the demographic groups most similar to Tlingit-Haida are Central American Indian (27.1%, a difference of 0.060%), Immigrants from Mexico (27.1%, a difference of 0.070%), Puget Sound Salish (27.2%, a difference of 0.12%), Mexican (27.2%, a difference of 0.22%), and Immigrants from Dominican Republic (27.0%, a difference of 0.39%).
| Demographics | Rating | Rank | Disability Age 65 to 74 |
| Bangladeshis | 0.0 /100 | #296 | Tragic 26.8% |
| Fijians | 0.0 /100 | #297 | Tragic 27.0% |
| Immigrants | Yemen | 0.0 /100 | #298 | Tragic 27.0% |
| Potawatomi | 0.0 /100 | #299 | Tragic 27.0% |
| Immigrants | Dominican Republic | 0.0 /100 | #300 | Tragic 27.0% |
| Immigrants | Mexico | 0.0 /100 | #301 | Tragic 27.1% |
| Central American Indians | 0.0 /100 | #302 | Tragic 27.1% |
| Tlingit-Haida | 0.0 /100 | #303 | Tragic 27.1% |
| Puget Sound Salish | 0.0 /100 | #304 | Tragic 27.2% |
| Mexicans | 0.0 /100 | #305 | Tragic 27.2% |
| Blacks/African Americans | 0.0 /100 | #306 | Tragic 27.3% |
| Ute | 0.0 /100 | #307 | Tragic 27.3% |
| Sioux | 0.0 /100 | #308 | Tragic 27.3% |
| Yaqui | 0.0 /100 | #309 | Tragic 27.4% |
| Shoshone | 0.0 /100 | #310 | Tragic 27.4% |