Basque vs Pakistani Disability Age 65 to 74
COMPARE
Basque
Pakistani
Disability Age 65 to 74
Disability Age 65 to 74 Comparison
Basques
Pakistanis
23.5%
DISABILITY AGE 65 TO 74
38.4/ 100
METRIC RATING
186th/ 347
METRIC RANK
23.2%
DISABILITY AGE 65 TO 74
57.0/ 100
METRIC RATING
168th/ 347
METRIC RANK
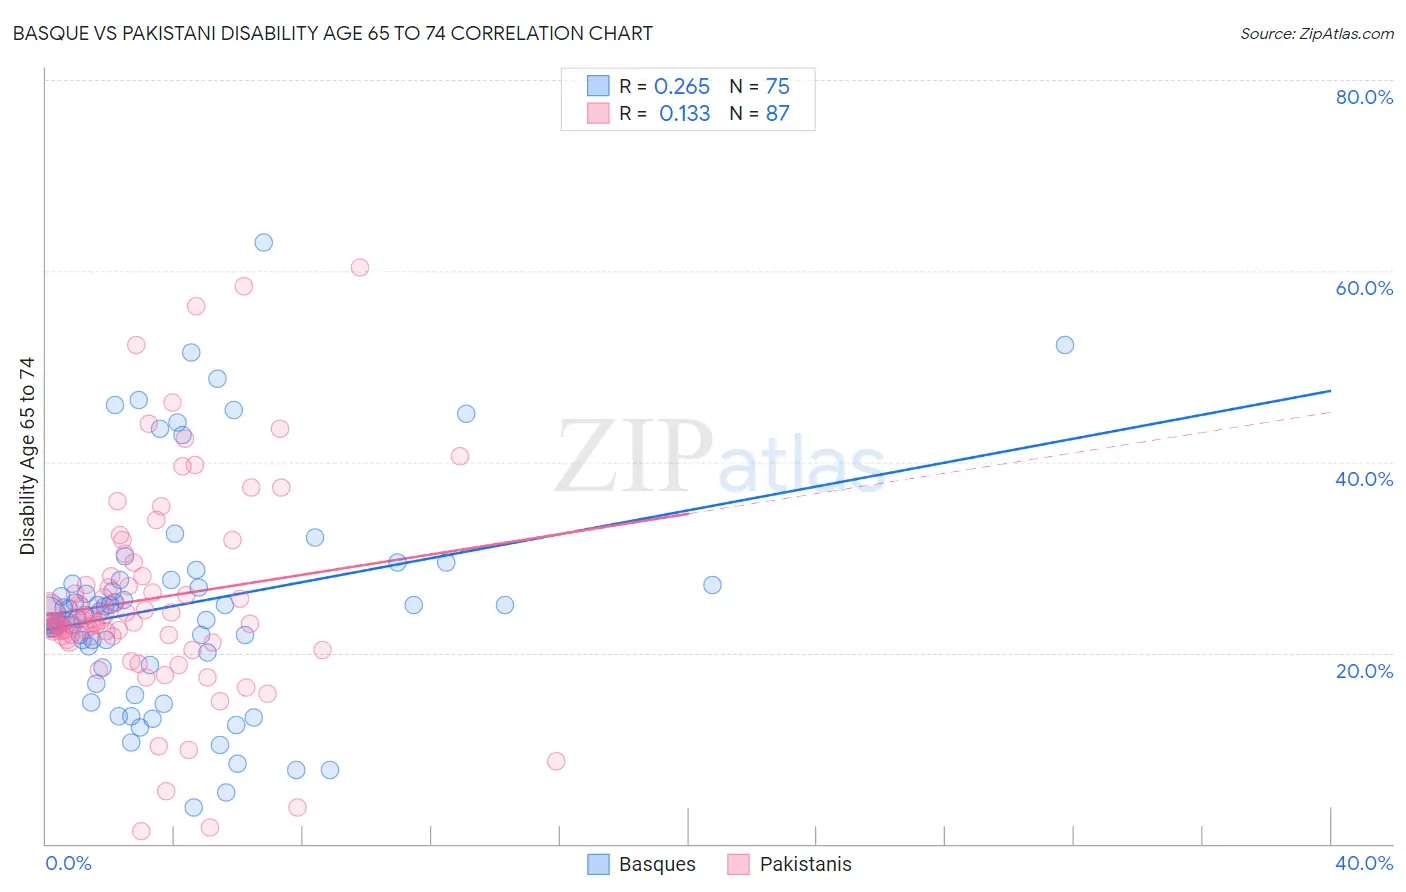
Basque vs Pakistani Disability Age 65 to 74 Correlation Chart
The statistical analysis conducted on geographies consisting of 165,654,682 people shows a weak positive correlation between the proportion of Basques and percentage of population with a disability between the ages 65 and 75 in the United States with a correlation coefficient (R) of 0.265 and weighted average of 23.5%. Similarly, the statistical analysis conducted on geographies consisting of 334,780,932 people shows a poor positive correlation between the proportion of Pakistanis and percentage of population with a disability between the ages 65 and 75 in the United States with a correlation coefficient (R) of 0.133 and weighted average of 23.2%, a difference of 1.1%.
Disability Age 65 to 74 Correlation Summary
| Measurement | Basque | Pakistani |
| Minimum | 3.8% | 1.3% |
| Maximum | 63.0% | 60.4% |
| Range | 59.1% | 59.1% |
| Mean | 25.1% | 25.7% |
| Median | 24.0% | 23.4% |
| Interquartile 25% (IQ1) | 18.7% | 21.4% |
| Interquartile 75% (IQ3) | 27.6% | 28.1% |
| Interquartile Range (IQR) | 8.8% | 6.7% |
| Standard Deviation (Sample) | 11.6% | 11.0% |
| Standard Deviation (Population) | 11.6% | 11.0% |
Demographics Similar to Basques and Pakistanis by Disability Age 65 to 74
In terms of disability age 65 to 74, the demographic groups most similar to Basques are Portuguese (23.5%, a difference of 0.040%), Haitian (23.4%, a difference of 0.24%), Immigrants from Germany (23.4%, a difference of 0.25%), Immigrants from Eastern Africa (23.4%, a difference of 0.27%), and Irish (23.4%, a difference of 0.36%). Similarly, the demographic groups most similar to Pakistanis are Immigrants from Bosnia and Herzegovina (23.2%, a difference of 0.040%), Icelander (23.3%, a difference of 0.16%), Moroccan (23.3%, a difference of 0.16%), Cuban (23.3%, a difference of 0.30%), and German (23.3%, a difference of 0.38%).
| Demographics | Rating | Rank | Disability Age 65 to 74 |
| Immigrants | Bosnia and Herzegovina | 57.6 /100 | #167 | Average 23.2% |
| Pakistanis | 57.0 /100 | #168 | Average 23.2% |
| Icelanders | 54.3 /100 | #169 | Average 23.3% |
| Moroccans | 54.2 /100 | #170 | Average 23.3% |
| Cubans | 51.9 /100 | #171 | Average 23.3% |
| Germans | 50.5 /100 | #172 | Average 23.3% |
| Yugoslavians | 50.2 /100 | #173 | Average 23.3% |
| Immigrants | South Eastern Asia | 50.0 /100 | #174 | Average 23.3% |
| Dutch | 49.4 /100 | #175 | Average 23.3% |
| Immigrants | Eritrea | 47.5 /100 | #176 | Average 23.4% |
| Immigrants | Haiti | 47.5 /100 | #177 | Average 23.4% |
| Guyanese | 45.8 /100 | #178 | Average 23.4% |
| Immigrants | Sierra Leone | 45.8 /100 | #179 | Average 23.4% |
| Scandinavians | 45.6 /100 | #180 | Average 23.4% |
| Assyrians/Chaldeans/Syriacs | 45.3 /100 | #181 | Average 23.4% |
| Irish | 44.4 /100 | #182 | Average 23.4% |
| Immigrants | Eastern Africa | 42.8 /100 | #183 | Average 23.4% |
| Immigrants | Germany | 42.5 /100 | #184 | Average 23.4% |
| Haitians | 42.4 /100 | #185 | Average 23.4% |
| Basques | 38.4 /100 | #186 | Fair 23.5% |
| Portuguese | 37.8 /100 | #187 | Fair 23.5% |