Basque vs Ottawa Ambulatory Disability
COMPARE
Basque
Ottawa
Ambulatory Disability
Ambulatory Disability Comparison
Basques
Ottawa
6.1%
AMBULATORY DISABILITY
63.7/ 100
METRIC RATING
164th/ 347
METRIC RANK
7.2%
AMBULATORY DISABILITY
0.0/ 100
METRIC RATING
318th/ 347
METRIC RANK
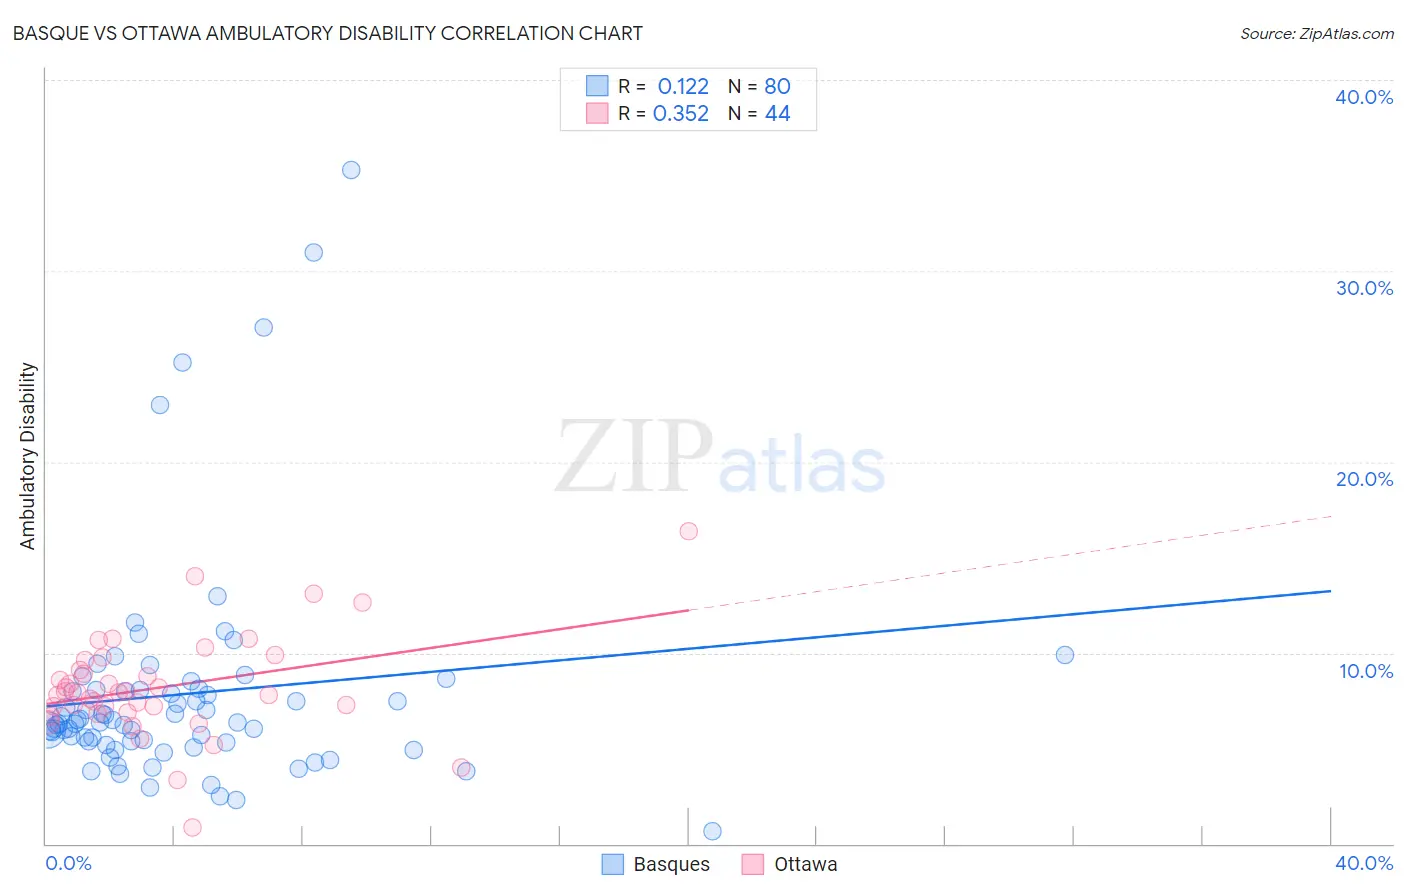
Basque vs Ottawa Ambulatory Disability Correlation Chart
The statistical analysis conducted on geographies consisting of 165,766,481 people shows a poor positive correlation between the proportion of Basques and percentage of population with ambulatory disability in the United States with a correlation coefficient (R) of 0.122 and weighted average of 6.1%. Similarly, the statistical analysis conducted on geographies consisting of 49,954,761 people shows a mild positive correlation between the proportion of Ottawa and percentage of population with ambulatory disability in the United States with a correlation coefficient (R) of 0.352 and weighted average of 7.2%, a difference of 17.9%.
Ambulatory Disability Correlation Summary
| Measurement | Basque | Ottawa |
| Minimum | 0.67% | 0.87% |
| Maximum | 35.3% | 16.4% |
| Range | 34.6% | 15.5% |
| Mean | 7.8% | 8.2% |
| Median | 6.4% | 7.9% |
| Interquartile 25% (IQ1) | 5.3% | 7.0% |
| Interquartile 75% (IQ3) | 8.0% | 9.4% |
| Interquartile Range (IQR) | 2.7% | 2.3% |
| Standard Deviation (Sample) | 5.8% | 2.7% |
| Standard Deviation (Population) | 5.8% | 2.7% |
Similar Demographics by Ambulatory Disability
Demographics Similar to Basques by Ambulatory Disability
In terms of ambulatory disability, the demographic groups most similar to Basques are Nicaraguan (6.1%, a difference of 0.030%), Iraqi (6.1%, a difference of 0.050%), Lebanese (6.1%, a difference of 0.15%), Immigrants from Oceania (6.1%, a difference of 0.17%), and Ecuadorian (6.1%, a difference of 0.18%).
| Demographics | Rating | Rank | Ambulatory Disability |
| Ghanaians | 71.3 /100 | #157 | Good 6.0% |
| Immigrants | Fiji | 71.2 /100 | #158 | Good 6.0% |
| Immigrants | Latvia | 71.1 /100 | #159 | Good 6.0% |
| Central Americans | 69.8 /100 | #160 | Good 6.0% |
| Immigrants | Belarus | 69.2 /100 | #161 | Good 6.1% |
| Nigerians | 67.1 /100 | #162 | Good 6.1% |
| Lebanese | 66.2 /100 | #163 | Good 6.1% |
| Basques | 63.7 /100 | #164 | Good 6.1% |
| Nicaraguans | 63.2 /100 | #165 | Good 6.1% |
| Iraqis | 62.8 /100 | #166 | Good 6.1% |
| Immigrants | Oceania | 60.7 /100 | #167 | Good 6.1% |
| Ecuadorians | 60.5 /100 | #168 | Good 6.1% |
| Immigrants | Southern Europe | 58.1 /100 | #169 | Average 6.1% |
| Immigrants | Ecuador | 53.8 /100 | #170 | Average 6.1% |
| Moroccans | 52.6 /100 | #171 | Average 6.1% |
Demographics Similar to Ottawa by Ambulatory Disability
In terms of ambulatory disability, the demographic groups most similar to Ottawa are Central American Indian (7.2%, a difference of 0.090%), Immigrants from Dominican Republic (7.1%, a difference of 0.17%), Dominican (7.2%, a difference of 0.33%), Shoshone (7.1%, a difference of 0.41%), and Blackfeet (7.1%, a difference of 0.43%).
| Demographics | Rating | Rank | Ambulatory Disability |
| Cree | 0.0 /100 | #311 | Tragic 7.1% |
| Delaware | 0.0 /100 | #312 | Tragic 7.1% |
| Immigrants | Yemen | 0.0 /100 | #313 | Tragic 7.1% |
| Blackfeet | 0.0 /100 | #314 | Tragic 7.1% |
| Shoshone | 0.0 /100 | #315 | Tragic 7.1% |
| Immigrants | Dominican Republic | 0.0 /100 | #316 | Tragic 7.1% |
| Central American Indians | 0.0 /100 | #317 | Tragic 7.2% |
| Ottawa | 0.0 /100 | #318 | Tragic 7.2% |
| Dominicans | 0.0 /100 | #319 | Tragic 7.2% |
| Potawatomi | 0.0 /100 | #320 | Tragic 7.3% |
| Apache | 0.0 /100 | #321 | Tragic 7.4% |
| Osage | 0.0 /100 | #322 | Tragic 7.4% |
| Americans | 0.0 /100 | #323 | Tragic 7.4% |
| Navajo | 0.0 /100 | #324 | Tragic 7.5% |
| Comanche | 0.0 /100 | #325 | Tragic 7.5% |