Immigrants from Asia vs Laotian Cognitive Disability
COMPARE
Immigrants from Asia
Laotian
Cognitive Disability
Cognitive Disability Comparison
Immigrants from Asia
Laotians
16.8%
COGNITIVE DISABILITY
98.1/ 100
METRIC RATING
101st/ 347
METRIC RANK
17.3%
COGNITIVE DISABILITY
50.0/ 100
METRIC RATING
174th/ 347
METRIC RANK
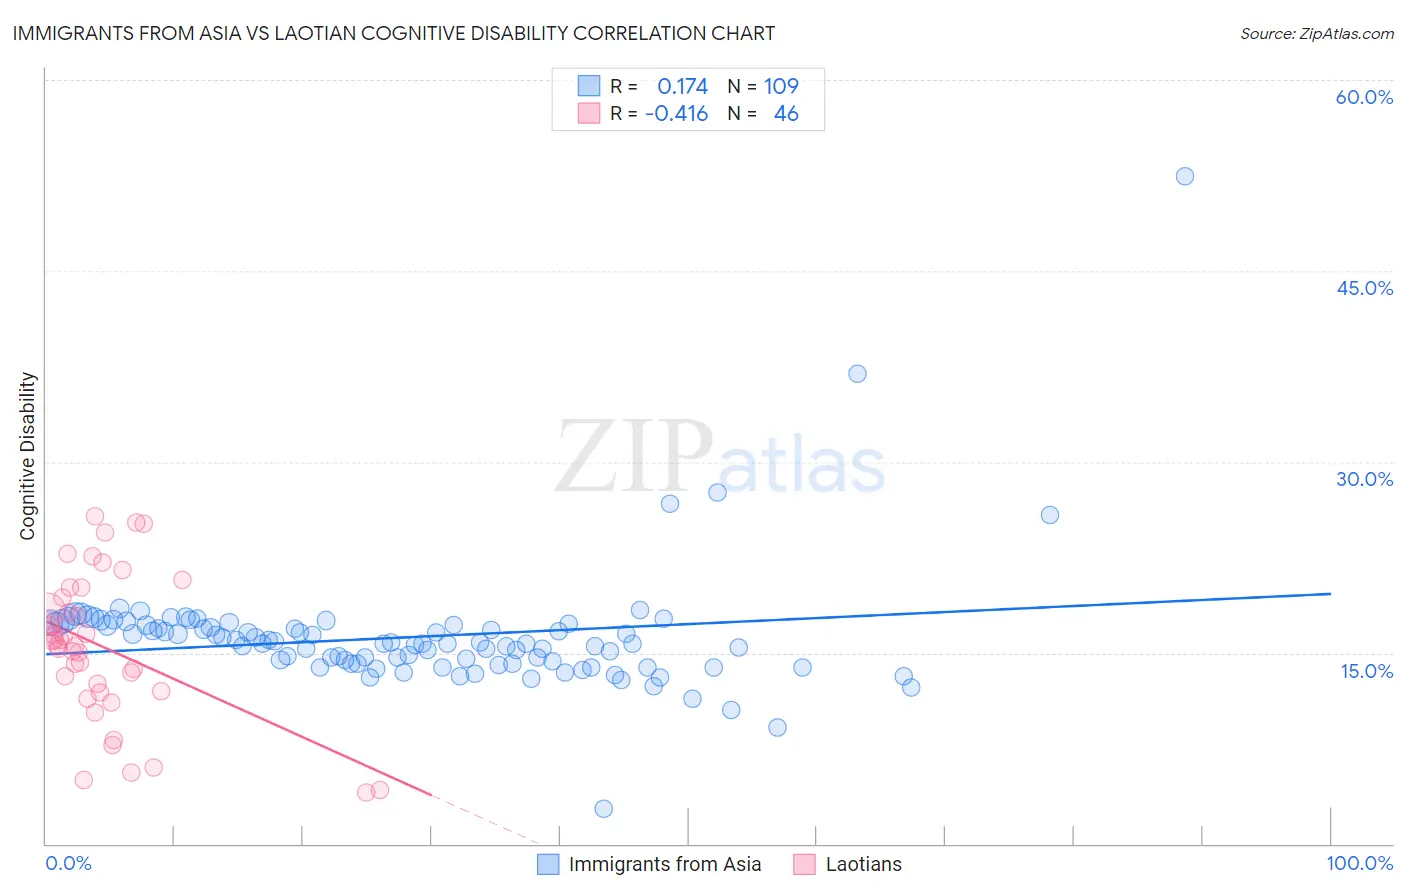
Immigrants from Asia vs Laotian Cognitive Disability Correlation Chart
The statistical analysis conducted on geographies consisting of 549,051,974 people shows a poor positive correlation between the proportion of Immigrants from Asia and percentage of population with cognitive disability in the United States with a correlation coefficient (R) of 0.174 and weighted average of 16.8%. Similarly, the statistical analysis conducted on geographies consisting of 224,855,635 people shows a moderate negative correlation between the proportion of Laotians and percentage of population with cognitive disability in the United States with a correlation coefficient (R) of -0.416 and weighted average of 17.3%, a difference of 2.9%.
Cognitive Disability Correlation Summary
| Measurement | Immigrants from Asia | Laotian |
| Minimum | 2.7% | 4.0% |
| Maximum | 52.5% | 25.7% |
| Range | 49.8% | 21.7% |
| Mean | 16.2% | 15.5% |
| Median | 15.7% | 15.7% |
| Interquartile 25% (IQ1) | 14.1% | 12.0% |
| Interquartile 75% (IQ3) | 17.2% | 19.3% |
| Interquartile Range (IQR) | 3.1% | 7.3% |
| Standard Deviation (Sample) | 5.0% | 5.7% |
| Standard Deviation (Population) | 4.9% | 5.6% |
Similar Demographics by Cognitive Disability
Demographics Similar to Immigrants from Asia by Cognitive Disability
In terms of cognitive disability, the demographic groups most similar to Immigrants from Asia are Immigrants from Russia (16.8%, a difference of 0.0%), Irish (16.8%, a difference of 0.030%), Jordanian (16.8%, a difference of 0.040%), Paraguayan (16.8%, a difference of 0.070%), and Palestinian (16.8%, a difference of 0.070%).
| Demographics | Rating | Rank | Cognitive Disability |
| Asians | 98.7 /100 | #94 | Exceptional 16.7% |
| English | 98.6 /100 | #95 | Exceptional 16.8% |
| Finns | 98.5 /100 | #96 | Exceptional 16.8% |
| Dutch | 98.5 /100 | #97 | Exceptional 16.8% |
| Immigrants | Lebanon | 98.4 /100 | #98 | Exceptional 16.8% |
| Jordanians | 98.2 /100 | #99 | Exceptional 16.8% |
| Immigrants | Russia | 98.2 /100 | #100 | Exceptional 16.8% |
| Immigrants | Asia | 98.1 /100 | #101 | Exceptional 16.8% |
| Irish | 98.1 /100 | #102 | Exceptional 16.8% |
| Paraguayans | 98.0 /100 | #103 | Exceptional 16.8% |
| Palestinians | 98.0 /100 | #104 | Exceptional 16.8% |
| Immigrants | Eastern Asia | 97.9 /100 | #105 | Exceptional 16.8% |
| Northern Europeans | 97.8 /100 | #106 | Exceptional 16.8% |
| Immigrants | Nicaragua | 97.8 /100 | #107 | Exceptional 16.8% |
| Canadians | 97.5 /100 | #108 | Exceptional 16.8% |
Demographics Similar to Laotians by Cognitive Disability
In terms of cognitive disability, the demographic groups most similar to Laotians are Immigrants from Northern Africa (17.3%, a difference of 0.010%), Tsimshian (17.3%, a difference of 0.010%), Shoshone (17.3%, a difference of 0.020%), Ute (17.3%, a difference of 0.030%), and Spanish (17.3%, a difference of 0.030%).
| Demographics | Rating | Rank | Cognitive Disability |
| Immigrants | Syria | 63.5 /100 | #167 | Good 17.2% |
| Immigrants | Immigrants | 62.5 /100 | #168 | Good 17.2% |
| Immigrants | Portugal | 61.8 /100 | #169 | Good 17.2% |
| Ecuadorians | 59.6 /100 | #170 | Average 17.2% |
| Tlingit-Haida | 59.4 /100 | #171 | Average 17.2% |
| Immigrants | Turkey | 56.7 /100 | #172 | Average 17.2% |
| Immigrants | Northern Africa | 50.2 /100 | #173 | Average 17.3% |
| Laotians | 50.0 /100 | #174 | Average 17.3% |
| Tsimshian | 49.8 /100 | #175 | Average 17.3% |
| Shoshone | 49.2 /100 | #176 | Average 17.3% |
| Ute | 49.1 /100 | #177 | Average 17.3% |
| Spanish | 48.9 /100 | #178 | Average 17.3% |
| Sioux | 48.6 /100 | #179 | Average 17.3% |
| Pakistanis | 43.9 /100 | #180 | Average 17.3% |
| Immigrants | Guyana | 42.9 /100 | #181 | Average 17.3% |