Cheyenne vs Laotian Cognitive Disability

COMPARE

Cheyenne
Race
Ancestry
AfghanAfricanAlaska NativeAlaskan AthabascanAlbanianAleutAlsatianAmericanApacheArabArapahoArgentineanArmenianAssyrian/Chaldean/SyriacAustralianAustrianBahamianBangladeshiBarbadianBasqueBelgianBelizeanBermudanBhutaneseBlackfeetBolivianBrazilianBritishBritish West IndianBulgarianBurmeseCajunCambodianCanadianCape VerdeanCarpatho RusynCelticCentral AmericanCentral American IndianCherokeeCheyenneChickasawChileanChineseChippewaChoctawColombianColvilleComancheCosta RicanCreeCreekCroatianCrowCubanCypriotCzechCzechoslovakianDanishDelawareDominicanDutchDutch West IndianEastern EuropeanEcuadorianEgyptianEnglishEstonianEthiopianEuropeanFijianFilipinoFinnishFrenchFrench American IndianFrench CanadianGermanGerman RussianGhanaianGreekGuamanian/ChamorroGuatemalanGuyaneseHaitianHmongHonduranHopiHoumaHungarianIcelanderIndian (Asian)IndonesianInupiatIranianIraqiIrishIroquoisIsraeliItalianJamaicanJapaneseJordanianKenyanKiowaKoreanLatvianLebaneseLiberianLithuanianLumbeeLuxembourgerMacedonianMalaysianMalteseMarshalleseMenomineeMexicanMexican American IndianMongolianMoroccanNative HawaiianNavajoNepaleseNew ZealanderNicaraguanNigerianNorthern EuropeanNorwegianOkinawanOsageOttawaPaiutePakistaniPalestinianPanamanianParaguayanPennsylvania GermanPeruvianPimaPolishPortuguesePotawatomiPuebloPuerto RicanPuget Sound SalishRomanianRussianSalvadoranSamoanScandinavianScotch-IrishScottishSeminoleSenegaleseSerbianShoshoneSierra LeoneanSiouxSlavicSlovakSloveneSomaliSouth AfricanSouth AmericanSouth American IndianSoviet UnionSpaniardSpanishSpanish AmericanSpanish American IndianSri LankanSubsaharan AfricanSudaneseSwedishSwissSyrianTaiwaneseThaiTlingit-HaidaTohono O'OdhamTonganTrinidadian and TobagonianTsimshianTurkishU.S. Virgin IslanderUgandanUkrainianUruguayanUteVenezuelanVietnameseWelshWest IndianYakamaYaquiYugoslavianYumanYup'ikZimbabwean
Immigration
NonimmigrantsImmigrantsAfghanistanAfricaAlbaniaArgentinaArmeniaAsiaAustraliaAustriaBahamasBangladeshBarbadosBelarusBelgiumBelizeBoliviaBosnia and HerzegovinaBrazilBulgariaBurma/MyanmarCabo VerdeCambodiaCameroonCanadaCaribbeanCentral AmericaChileChinaColombiaCongoCosta RicaCroatiaCubaCzechoslovakiaDenmarkDominicaDominican RepublicEastern AfricaEastern AsiaEastern EuropeEcuadorEgyptEl SalvadorEnglandEritreaEthiopiaEuropeFijiFranceGermanyGhanaGreeceGrenadaGuatemalaGuyanaHaitiHondurasHong KongHungaryIndiaIndonesiaIranIraqIrelandIsraelItalyJamaicaJapanJordanKazakhstanKenyaKoreaKuwaitLaosLatin AmericaLatviaLebanonLiberiaLithuaniaMalaysiaMexicoMicronesiaMiddle AfricaMoldovaMoroccoNepalNetherlandsNicaraguaNigeriaNorth AmericaNorth MacedoniaNorthern AfricaNorthern EuropeNorwayOceaniaPakistanPanamaPeruPhilippinesPolandPortugalRomaniaRussiaSaudi ArabiaScotlandSenegalSerbiaSierra LeoneSingaporeSomaliaSouth AfricaSouth AmericaSouth Central AsiaSouth Eastern AsiaSouthern EuropeSpainSri LankaSt. Vincent and the GrenadinesSudanSwedenSwitzerlandSyriaTaiwanThailandTrinidad and TobagoTurkeyUgandaUkraineUruguayUzbekistanVenezuelaVietnamWest IndiesWestern AfricaWestern AsiaWestern EuropeYemenZaireZimbabweAzores
Laotian
Race
Ancestry
AfghanAfricanAlaska NativeAlaskan AthabascanAlbanianAleutAlsatianAmericanApacheArabArapahoArgentineanArmenianAssyrian/Chaldean/SyriacAustralianAustrianBahamianBangladeshiBarbadianBasqueBelgianBelizeanBermudanBhutaneseBlackfeetBolivianBrazilianBritishBritish West IndianBulgarianBurmeseCajunCambodianCanadianCape VerdeanCarpatho RusynCelticCentral AmericanCentral American IndianCherokeeChickasawChileanChineseChippewaChoctawColombianColvilleComancheCosta RicanCreeCreekCroatianCrowCubanCypriotCzechCzechoslovakianDanishDelawareDominicanDutchDutch West IndianEastern EuropeanEcuadorianEgyptianEnglishEstonianEthiopianEuropeanFijianFilipinoFinnishFrenchFrench American IndianFrench CanadianGermanGerman RussianGhanaianGreekGuamanian/ChamorroGuatemalanGuyaneseHaitianHmongHonduranHopiHoumaHungarianIcelanderIndian (Asian)IndonesianInupiatIranianIraqiIrishIroquoisIsraeliItalianJamaicanJapaneseJordanianKenyanKiowaKoreanLaotianLatvianLebaneseLiberianLithuanianLumbeeLuxembourgerMacedonianMalaysianMalteseMarshalleseMenomineeMexicanMexican American IndianMongolianMoroccanNative HawaiianNavajoNepaleseNew ZealanderNicaraguanNigerianNorthern EuropeanNorwegianOkinawanOsageOttawaPaiutePakistaniPalestinianPanamanianParaguayanPennsylvania GermanPeruvianPimaPolishPortuguesePotawatomiPuebloPuerto RicanPuget Sound SalishRomanianRussianSalvadoranSamoanScandinavianScotch-IrishScottishSeminoleSenegaleseSerbianShoshoneSierra LeoneanSiouxSlavicSlovakSloveneSomaliSouth AfricanSouth AmericanSouth American IndianSoviet UnionSpaniardSpanishSpanish AmericanSpanish American IndianSri LankanSubsaharan AfricanSudaneseSwedishSwissSyrianTaiwaneseThaiTlingit-HaidaTohono O'OdhamTonganTrinidadian and TobagonianTsimshianTurkishU.S. Virgin IslanderUgandanUkrainianUruguayanUteVenezuelanVietnameseWelshWest IndianYakamaYaquiYugoslavianYumanYup'ikZimbabwean
Immigration
NonimmigrantsImmigrantsAfghanistanAfricaAlbaniaArgentinaArmeniaAsiaAustraliaAustriaBahamasBangladeshBarbadosBelarusBelgiumBelizeBoliviaBosnia and HerzegovinaBrazilBulgariaBurma/MyanmarCabo VerdeCambodiaCameroonCanadaCaribbeanCentral AmericaChileChinaColombiaCongoCosta RicaCroatiaCubaCzechoslovakiaDenmarkDominicaDominican RepublicEastern AfricaEastern AsiaEastern EuropeEcuadorEgyptEl SalvadorEnglandEritreaEthiopiaEuropeFijiFranceGermanyGhanaGreeceGrenadaGuatemalaGuyanaHaitiHondurasHong KongHungaryIndiaIndonesiaIranIraqIrelandIsraelItalyJamaicaJapanJordanKazakhstanKenyaKoreaKuwaitLaosLatin AmericaLatviaLebanonLiberiaLithuaniaMalaysiaMexicoMicronesiaMiddle AfricaMoldovaMoroccoNepalNetherlandsNicaraguaNigeriaNorth AmericaNorth MacedoniaNorthern AfricaNorthern EuropeNorwayOceaniaPakistanPanamaPeruPhilippinesPolandPortugalRomaniaRussiaSaudi ArabiaScotlandSenegalSerbiaSierra LeoneSingaporeSomaliaSouth AfricaSouth AmericaSouth Central AsiaSouth Eastern AsiaSouthern EuropeSpainSri LankaSt. Vincent and the GrenadinesSudanSwedenSwitzerlandSyriaTaiwanThailandTrinidad and TobagoTurkeyUgandaUkraineUruguayUzbekistanVenezuelaVietnamWest IndiesWestern AfricaWestern AsiaWestern EuropeYemenZaireZimbabweAzores
Cognitive Disability
Income
Poverty
Unemployment
Labor Participation
Family Structure
Vehicle Availability
Education Level
Disability

Cognitive Disability Comparison

Cheyenne

Laotians

Tragic
Average
17.8%
COGNITIVE DISABILITY
1.7/ 100
METRIC RATING
238th/ 347
METRIC RANK
17.3%
COGNITIVE DISABILITY
50.0/ 100
METRIC RATING
174th/ 347
METRIC RANK

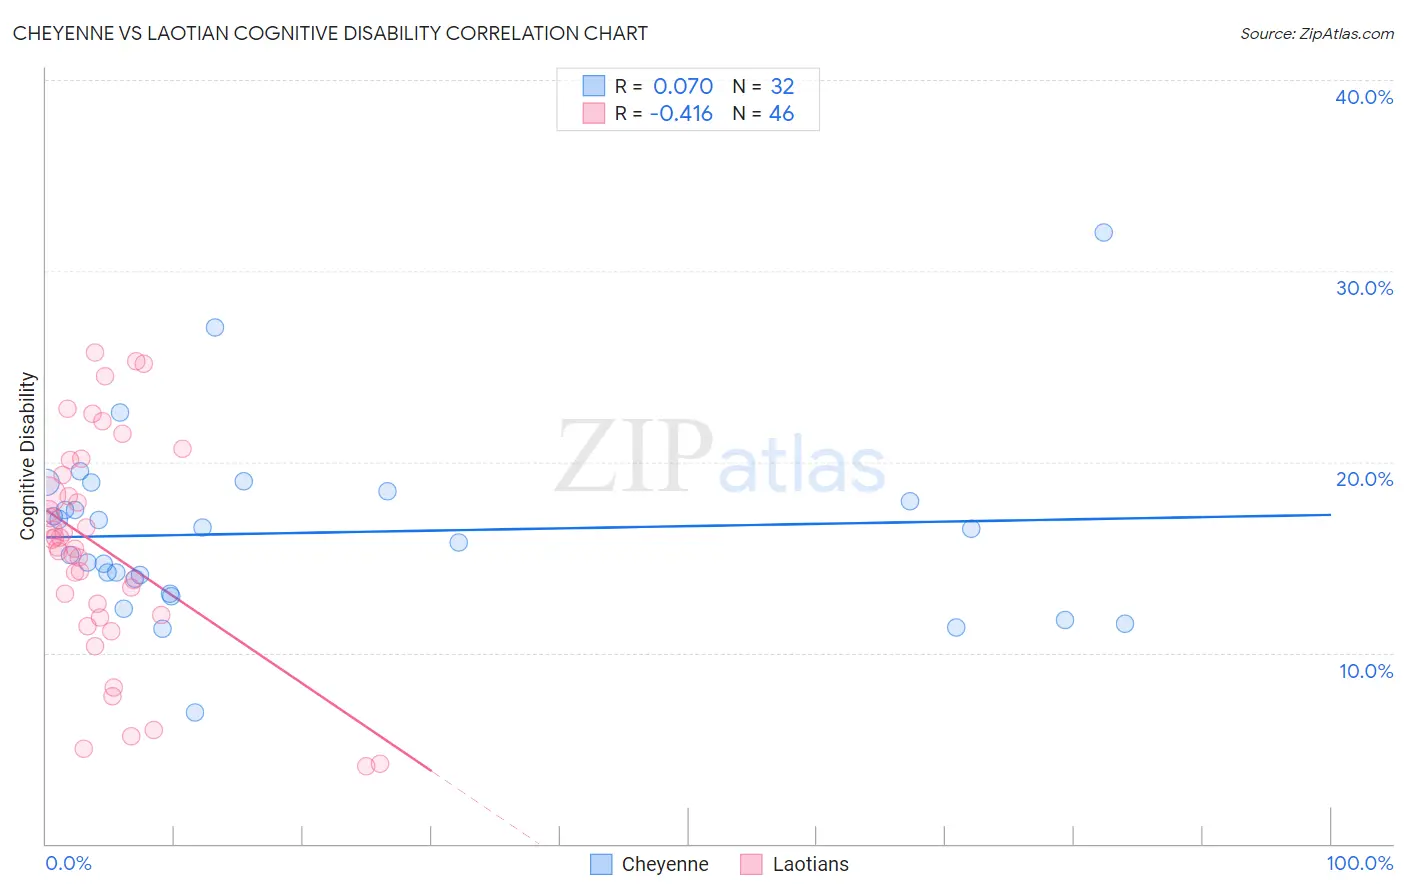
Cheyenne vs Laotian Cognitive Disability Correlation Chart

The statistical analysis conducted on geographies consisting of 80,710,475 people shows a slight positive correlation between the proportion of Cheyenne and percentage of population with cognitive disability in the United States with a correlation coefficient (R) of 0.070 and weighted average of 17.8%. Similarly, the statistical analysis conducted on geographies consisting of 224,855,635 people shows a moderate negative correlation between the proportion of Laotians and percentage of population with cognitive disability in the United States with a correlation coefficient (R) of -0.416 and weighted average of 17.3%, a difference of 2.9%.
Cheyenne vs Laotian Cognitive Disability

Cognitive Disability Correlation Summary

MeasurementCheyenneLaotian
Minimum6.9%4.0%
Maximum32.0%25.7%
Range25.1%21.7%
Mean16.3%15.5%
Median16.2%15.7%
Interquartile 25% (IQ1)13.5%12.0%
Interquartile 75% (IQ3)18.2%19.3%
Interquartile Range (IQR)4.7%7.3%
Standard Deviation (Sample)4.7%5.7%
Standard Deviation (Population)4.6%5.6%

Similar Demographics by Cognitive Disability

Demographics Similar to Cheyenne by Cognitive Disability

In terms of cognitive disability, the demographic groups most similar to Cheyenne are Immigrants from Iraq (17.8%, a difference of 0.040%), Immigrants from Mexico (17.8%, a difference of 0.040%), Osage (17.8%, a difference of 0.10%), Spanish American Indian (17.8%, a difference of 0.10%), and Panamanian (17.8%, a difference of 0.12%).
DemographicsRating | RankCognitive Disability
Guatemalans
2.1
/100
|
#231
Tragic
17.8%
Tongans
2.1
/100
|
#232
Tragic
17.8%
Panamanians
2.1
/100
|
#233
Tragic
17.8%
Osage
2.0
/100
|
#234
Tragic
17.8%
Spanish American Indians
2.0
/100
|
#235
Tragic
17.8%
Immigrants | Iraq
1.8
/100
|
#236
Tragic
17.8%
Immigrants | Mexico
1.8
/100
|
#237
Tragic
17.8%
Cheyenne
1.7
/100
|
#238
Tragic
17.8%
Cajuns
1.4
/100
|
#239
Tragic
17.8%
Iraqis
1.4
/100
|
#240
Tragic
17.8%
Mexicans
1.1
/100
|
#241
Tragic
17.8%
Paiute
1.1
/100
|
#242
Tragic
17.8%
Immigrants | Bangladesh
1.0
/100
|
#243
Tragic
17.8%
Jamaicans
0.9
/100
|
#244
Tragic
17.9%
Trinidadians and Tobagonians
0.8
/100
|
#245
Tragic
17.9%

Demographics Similar to Laotians by Cognitive Disability

In terms of cognitive disability, the demographic groups most similar to Laotians are Immigrants from Northern Africa (17.3%, a difference of 0.010%), Tsimshian (17.3%, a difference of 0.010%), Shoshone (17.3%, a difference of 0.020%), Ute (17.3%, a difference of 0.030%), and Spanish (17.3%, a difference of 0.030%).
DemographicsRating | RankCognitive Disability
Immigrants | Syria
63.5
/100
|
#167
Good
17.2%
Immigrants | Immigrants
62.5
/100
|
#168
Good
17.2%
Immigrants | Portugal
61.8
/100
|
#169
Good
17.2%
Ecuadorians
59.6
/100
|
#170
Average
17.2%
Tlingit-Haida
59.4
/100
|
#171
Average
17.2%
Immigrants | Turkey
56.7
/100
|
#172
Average
17.2%
Immigrants | Northern Africa
50.2
/100
|
#173
Average
17.3%
Laotians
50.0
/100
|
#174
Average
17.3%
Tsimshian
49.8
/100
|
#175
Average
17.3%
Shoshone
49.2
/100
|
#176
Average
17.3%
Ute
49.1
/100
|
#177
Average
17.3%
Spanish
48.9
/100
|
#178
Average
17.3%
Sioux
48.6
/100
|
#179
Average
17.3%
Pakistanis
43.9
/100
|
#180
Average
17.3%
Immigrants | Guyana
42.9
/100
|
#181
Average
17.3%