Immigrants from Nigeria vs Immigrants from Latvia Cognitive Disability
COMPARE
Immigrants from Nigeria
Immigrants from Latvia
Cognitive Disability
Cognitive Disability Comparison
Immigrants from Nigeria
Immigrants from Latvia
18.0%
COGNITIVE DISABILITY
0.2/ 100
METRIC RATING
274th/ 347
METRIC RANK
17.2%
COGNITIVE DISABILITY
73.2/ 100
METRIC RATING
159th/ 347
METRIC RANK
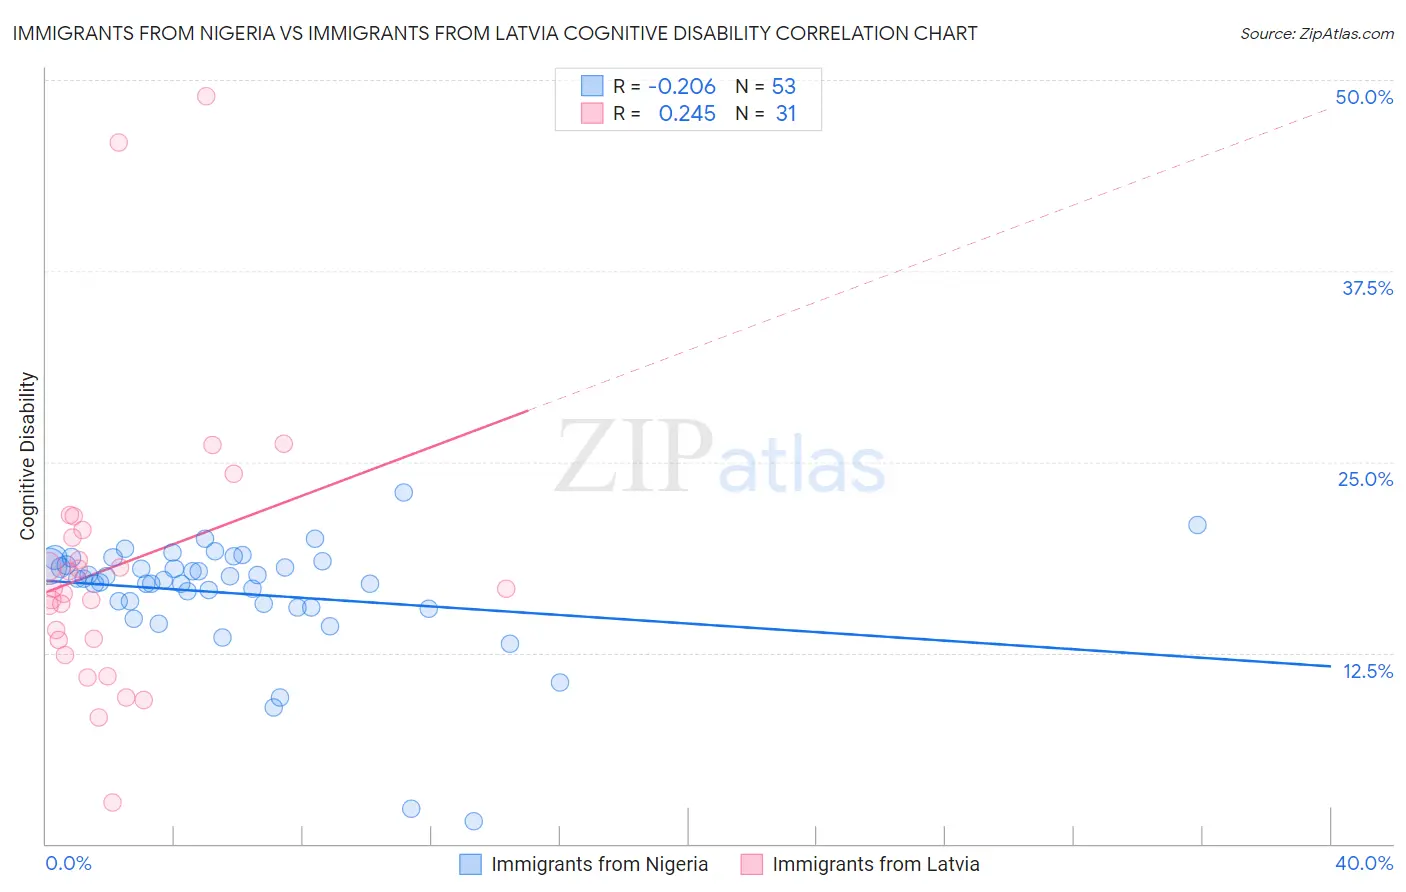
Immigrants from Nigeria vs Immigrants from Latvia Cognitive Disability Correlation Chart
The statistical analysis conducted on geographies consisting of 283,477,063 people shows a weak negative correlation between the proportion of Immigrants from Nigeria and percentage of population with cognitive disability in the United States with a correlation coefficient (R) of -0.206 and weighted average of 18.0%. Similarly, the statistical analysis conducted on geographies consisting of 113,738,689 people shows a weak positive correlation between the proportion of Immigrants from Latvia and percentage of population with cognitive disability in the United States with a correlation coefficient (R) of 0.245 and weighted average of 17.2%, a difference of 5.2%.
Cognitive Disability Correlation Summary
| Measurement | Immigrants from Nigeria | Immigrants from Latvia |
| Minimum | 1.5% | 2.7% |
| Maximum | 23.0% | 49.0% |
| Range | 21.5% | 46.2% |
| Mean | 16.4% | 18.2% |
| Median | 17.3% | 16.7% |
| Interquartile 25% (IQ1) | 15.6% | 13.4% |
| Interquartile 75% (IQ3) | 18.4% | 20.5% |
| Interquartile Range (IQR) | 2.7% | 7.2% |
| Standard Deviation (Sample) | 3.8% | 9.4% |
| Standard Deviation (Population) | 3.8% | 9.2% |
Similar Demographics by Cognitive Disability
Demographics Similar to Immigrants from Nigeria by Cognitive Disability
In terms of cognitive disability, the demographic groups most similar to Immigrants from Nigeria are Immigrants from Nepal (18.0%, a difference of 0.010%), Immigrants from Laos (18.1%, a difference of 0.10%), Immigrants from Honduras (18.0%, a difference of 0.13%), Potawatomi (18.0%, a difference of 0.14%), and Yuman (18.1%, a difference of 0.15%).
| Demographics | Rating | Rank | Cognitive Disability |
| Nepalese | 0.3 /100 | #267 | Tragic 18.0% |
| Cherokee | 0.3 /100 | #268 | Tragic 18.0% |
| Hondurans | 0.3 /100 | #269 | Tragic 18.0% |
| Immigrants | Bahamas | 0.3 /100 | #270 | Tragic 18.0% |
| Potawatomi | 0.2 /100 | #271 | Tragic 18.0% |
| Immigrants | Honduras | 0.2 /100 | #272 | Tragic 18.0% |
| Immigrants | Nepal | 0.2 /100 | #273 | Tragic 18.0% |
| Immigrants | Nigeria | 0.2 /100 | #274 | Tragic 18.0% |
| Immigrants | Laos | 0.2 /100 | #275 | Tragic 18.1% |
| Yuman | 0.2 /100 | #276 | Tragic 18.1% |
| Immigrants | Kuwait | 0.2 /100 | #277 | Tragic 18.1% |
| Immigrants | Micronesia | 0.2 /100 | #278 | Tragic 18.1% |
| Chippewa | 0.1 /100 | #279 | Tragic 18.1% |
| West Indians | 0.1 /100 | #280 | Tragic 18.1% |
| Yakama | 0.1 /100 | #281 | Tragic 18.1% |
Demographics Similar to Immigrants from Latvia by Cognitive Disability
In terms of cognitive disability, the demographic groups most similar to Immigrants from Latvia are Celtic (17.1%, a difference of 0.030%), Australian (17.2%, a difference of 0.030%), American (17.2%, a difference of 0.040%), Yugoslavian (17.2%, a difference of 0.060%), and Immigrants from Switzerland (17.2%, a difference of 0.060%).
| Demographics | Rating | Rank | Cognitive Disability |
| Immigrants | Indonesia | 82.7 /100 | #152 | Excellent 17.1% |
| Immigrants | Kazakhstan | 80.5 /100 | #153 | Excellent 17.1% |
| Immigrants | Malaysia | 79.3 /100 | #154 | Good 17.1% |
| Brazilians | 78.9 /100 | #155 | Good 17.1% |
| Sri Lankans | 78.9 /100 | #156 | Good 17.1% |
| Immigrants | Australia | 76.0 /100 | #157 | Good 17.1% |
| Celtics | 74.1 /100 | #158 | Good 17.1% |
| Immigrants | Latvia | 73.2 /100 | #159 | Good 17.2% |
| Australians | 72.4 /100 | #160 | Good 17.2% |
| Americans | 72.2 /100 | #161 | Good 17.2% |
| Yugoslavians | 71.6 /100 | #162 | Good 17.2% |
| Immigrants | Switzerland | 71.5 /100 | #163 | Good 17.2% |
| Armenians | 70.1 /100 | #164 | Good 17.2% |
| Immigrants | Albania | 64.9 /100 | #165 | Good 17.2% |
| Immigrants | Ecuador | 64.4 /100 | #166 | Good 17.2% |