Thai vs Immigrants from Belgium Male Disability
COMPARE
Thai
Immigrants from Belgium
Male Disability
Male Disability Comparison
Thais
Immigrants from Belgium
9.2%
MALE DISABILITY
100.0/ 100
METRIC RATING
4th/ 347
METRIC RANK
10.8%
MALE DISABILITY
94.2/ 100
METRIC RATING
108th/ 347
METRIC RANK
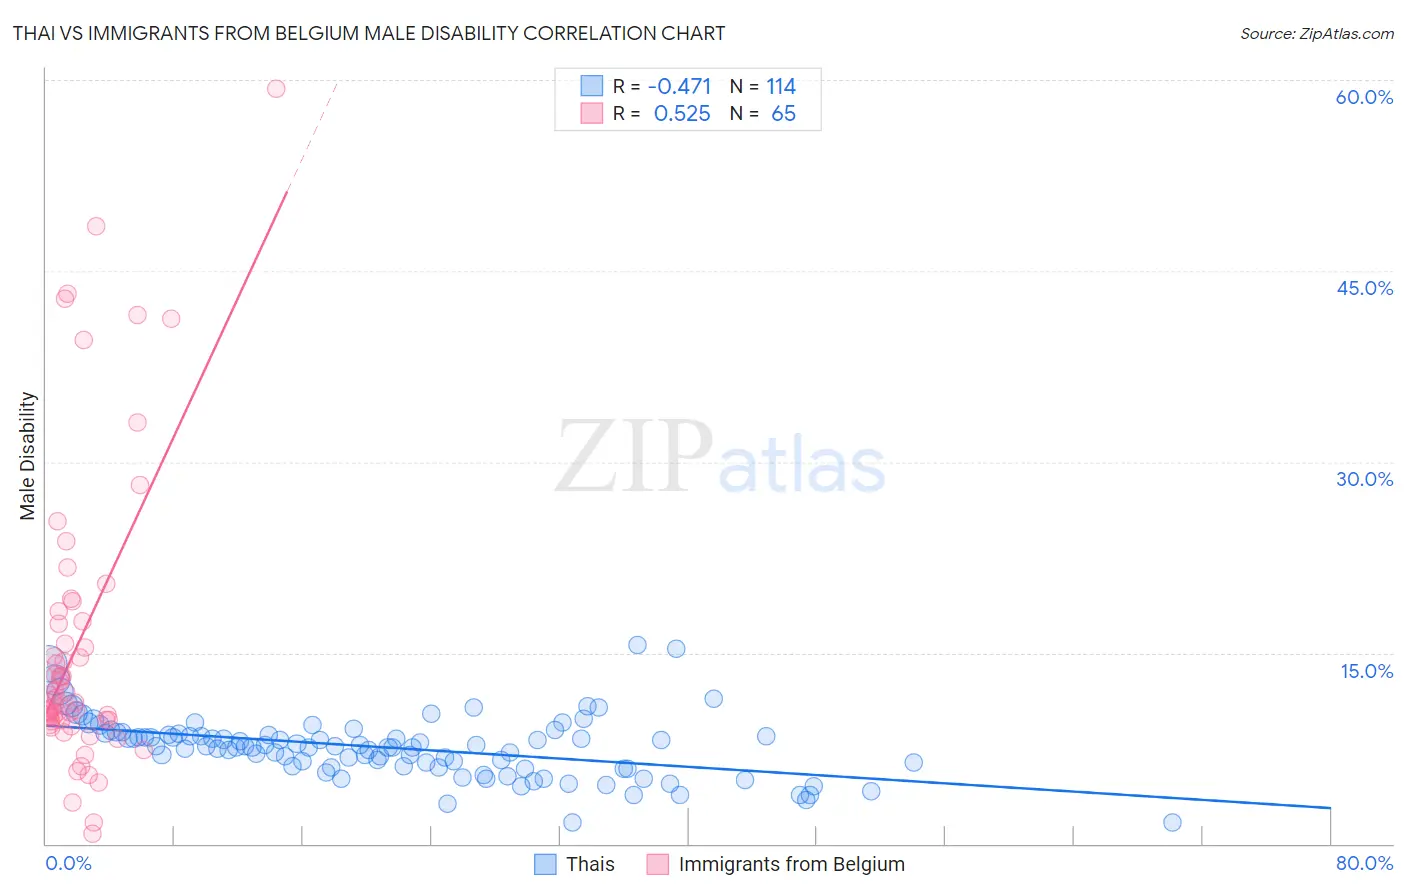
Thai vs Immigrants from Belgium Male Disability Correlation Chart
The statistical analysis conducted on geographies consisting of 475,773,320 people shows a moderate negative correlation between the proportion of Thais and percentage of males with a disability in the United States with a correlation coefficient (R) of -0.471 and weighted average of 9.2%. Similarly, the statistical analysis conducted on geographies consisting of 146,717,814 people shows a substantial positive correlation between the proportion of Immigrants from Belgium and percentage of males with a disability in the United States with a correlation coefficient (R) of 0.525 and weighted average of 10.8%, a difference of 16.9%.
Male Disability Correlation Summary
| Measurement | Thai | Immigrants from Belgium |
| Minimum | 1.6% | 0.83% |
| Maximum | 15.6% | 59.3% |
| Range | 14.0% | 58.5% |
| Mean | 7.5% | 15.9% |
| Median | 7.6% | 11.3% |
| Interquartile 25% (IQ1) | 6.0% | 9.7% |
| Interquartile 75% (IQ3) | 8.6% | 17.9% |
| Interquartile Range (IQR) | 2.5% | 8.2% |
| Standard Deviation (Sample) | 2.4% | 11.9% |
| Standard Deviation (Population) | 2.4% | 11.8% |
Similar Demographics by Male Disability
Demographics Similar to Thais by Male Disability
In terms of male disability, the demographic groups most similar to Thais are Filipino (9.1%, a difference of 1.3%), Immigrants from Taiwan (9.1%, a difference of 1.3%), Immigrants from Hong Kong (9.4%, a difference of 2.1%), Immigrants from South Central Asia (9.4%, a difference of 2.2%), and Immigrants from India (9.0%, a difference of 2.2%).
| Demographics | Rating | Rank | Male Disability |
| Immigrants | India | 100.0 /100 | #1 | Exceptional 9.0% |
| Immigrants | Taiwan | 100.0 /100 | #2 | Exceptional 9.1% |
| Filipinos | 100.0 /100 | #3 | Exceptional 9.1% |
| Thais | 100.0 /100 | #4 | Exceptional 9.2% |
| Immigrants | Hong Kong | 100.0 /100 | #5 | Exceptional 9.4% |
| Immigrants | South Central Asia | 100.0 /100 | #6 | Exceptional 9.4% |
| Immigrants | Bolivia | 100.0 /100 | #7 | Exceptional 9.5% |
| Immigrants | China | 100.0 /100 | #8 | Exceptional 9.5% |
| Immigrants | Singapore | 100.0 /100 | #9 | Exceptional 9.5% |
| Immigrants | Israel | 100.0 /100 | #10 | Exceptional 9.6% |
| Immigrants | Eastern Asia | 100.0 /100 | #11 | Exceptional 9.6% |
| Bolivians | 100.0 /100 | #12 | Exceptional 9.6% |
| Iranians | 100.0 /100 | #13 | Exceptional 9.7% |
| Immigrants | Iran | 100.0 /100 | #14 | Exceptional 9.7% |
| Indians (Asian) | 100.0 /100 | #15 | Exceptional 9.7% |
Demographics Similar to Immigrants from Belgium by Male Disability
In terms of male disability, the demographic groups most similar to Immigrants from Belgium are Immigrants from Eastern Africa (10.8%, a difference of 0.020%), Immigrants from Uganda (10.8%, a difference of 0.050%), Immigrants (10.8%, a difference of 0.080%), Immigrants from Uruguay (10.8%, a difference of 0.11%), and Immigrants from Syria (10.8%, a difference of 0.19%).
| Demographics | Rating | Rank | Male Disability |
| Immigrants | Greece | 95.6 /100 | #101 | Exceptional 10.7% |
| Immigrants | Eastern Europe | 95.3 /100 | #102 | Exceptional 10.7% |
| Uruguayans | 95.3 /100 | #103 | Exceptional 10.7% |
| Immigrants | Nigeria | 95.1 /100 | #104 | Exceptional 10.8% |
| Immigrants | Brazil | 95.0 /100 | #105 | Exceptional 10.8% |
| Immigrants | Syria | 94.9 /100 | #106 | Exceptional 10.8% |
| Immigrants | Eastern Africa | 94.3 /100 | #107 | Exceptional 10.8% |
| Immigrants | Belgium | 94.2 /100 | #108 | Exceptional 10.8% |
| Immigrants | Uganda | 94.0 /100 | #109 | Exceptional 10.8% |
| Immigrants | Immigrants | 93.9 /100 | #110 | Exceptional 10.8% |
| Immigrants | Uruguay | 93.8 /100 | #111 | Exceptional 10.8% |
| Ghanaians | 93.4 /100 | #112 | Exceptional 10.8% |
| Immigrants | Zimbabwe | 93.0 /100 | #113 | Exceptional 10.8% |
| Central Americans | 92.7 /100 | #114 | Exceptional 10.8% |
| Immigrants | Barbados | 92.2 /100 | #115 | Exceptional 10.8% |