Barbadian vs Puget Sound Salish Unemployment Among Youth under 25 years
COMPARE
Barbadian
Puget Sound Salish
Unemployment Among Youth under 25 years
Unemployment Among Youth under 25 years Comparison
Barbadians
Puget Sound Salish
14.6%
UNEMPLOYMENT AMONG YOUTH UNDER 25 YEARS
0.0/ 100
METRIC RATING
320th/ 347
METRIC RANK
12.5%
UNEMPLOYMENT AMONG YOUTH UNDER 25 YEARS
0.1/ 100
METRIC RATING
264th/ 347
METRIC RANK
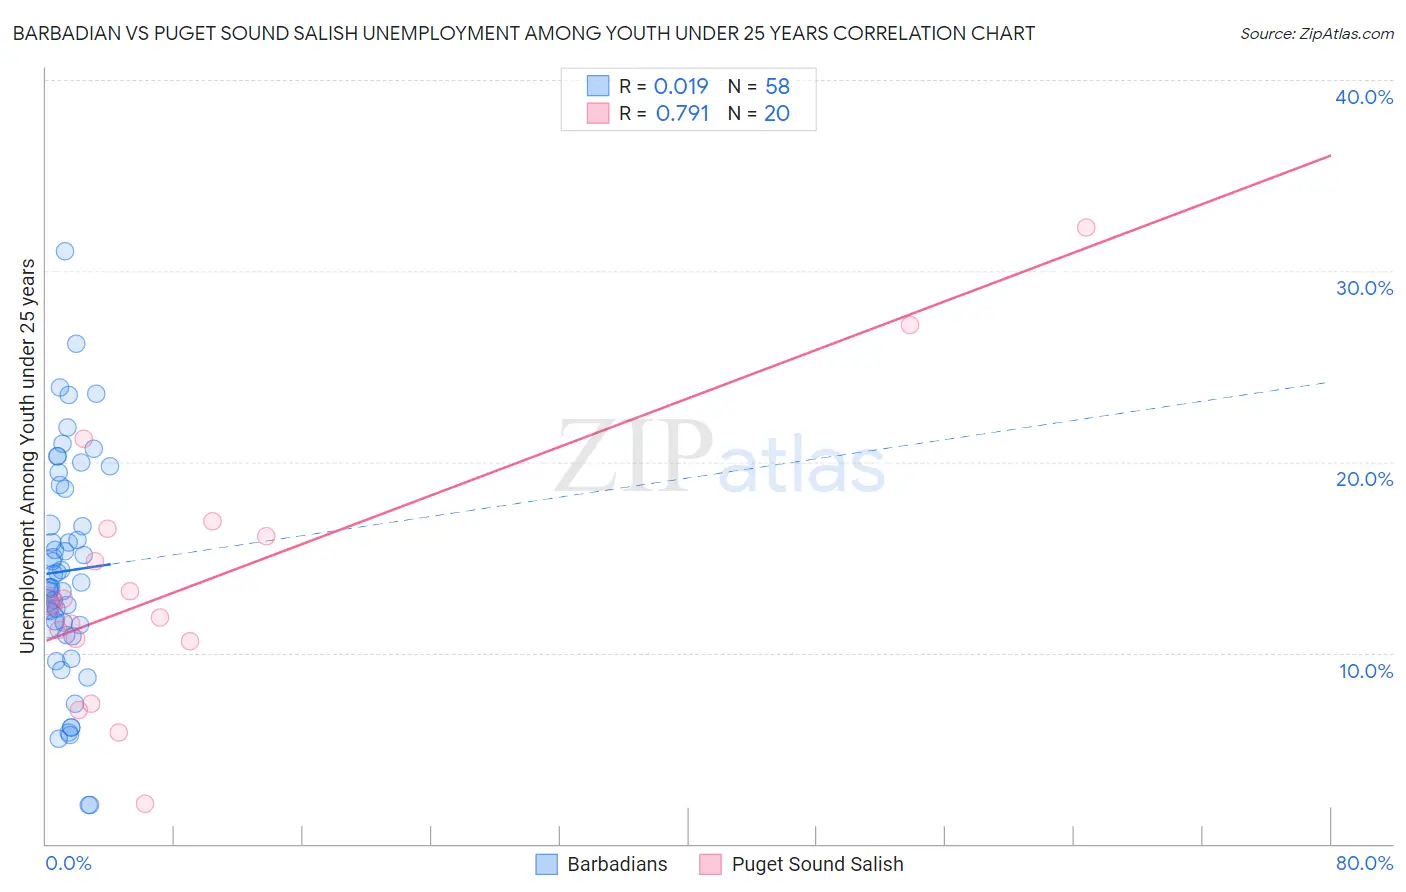
Barbadian vs Puget Sound Salish Unemployment Among Youth under 25 years Correlation Chart
The statistical analysis conducted on geographies consisting of 140,921,379 people shows no correlation between the proportion of Barbadians and unemployment rate among youth under the age of 25 in the United States with a correlation coefficient (R) of 0.019 and weighted average of 14.6%. Similarly, the statistical analysis conducted on geographies consisting of 45,930,945 people shows a strong positive correlation between the proportion of Puget Sound Salish and unemployment rate among youth under the age of 25 in the United States with a correlation coefficient (R) of 0.791 and weighted average of 12.5%, a difference of 16.7%.
Unemployment Among Youth under 25 years Correlation Summary
| Measurement | Barbadian | Puget Sound Salish |
| Minimum | 2.0% | 2.1% |
| Maximum | 31.0% | 32.3% |
| Range | 29.0% | 30.2% |
| Mean | 14.3% | 13.7% |
| Median | 13.6% | 12.6% |
| Interquartile 25% (IQ1) | 11.5% | 10.7% |
| Interquartile 75% (IQ3) | 18.6% | 16.3% |
| Interquartile Range (IQR) | 7.1% | 5.6% |
| Standard Deviation (Sample) | 5.8% | 7.0% |
| Standard Deviation (Population) | 5.8% | 6.8% |
Similar Demographics by Unemployment Among Youth under 25 years
Demographics Similar to Barbadians by Unemployment Among Youth under 25 years
In terms of unemployment among youth under 25 years, the demographic groups most similar to Barbadians are West Indian (14.6%, a difference of 0.040%), Immigrants from Dominica (14.6%, a difference of 0.080%), Cheyenne (14.6%, a difference of 0.16%), Trinidadian and Tobagonian (14.6%, a difference of 0.23%), and Immigrants from Trinidad and Tobago (14.6%, a difference of 0.32%).
| Demographics | Rating | Rank | Unemployment Among Youth under 25 years |
| Immigrants | Armenia | 0.0 /100 | #313 | Tragic 14.4% |
| Jamaicans | 0.0 /100 | #314 | Tragic 14.4% |
| Sioux | 0.0 /100 | #315 | Tragic 14.4% |
| Natives/Alaskans | 0.0 /100 | #316 | Tragic 14.5% |
| Blacks/African Americans | 0.0 /100 | #317 | Tragic 14.5% |
| Immigrants | Dominica | 0.0 /100 | #318 | Tragic 14.6% |
| West Indians | 0.0 /100 | #319 | Tragic 14.6% |
| Barbadians | 0.0 /100 | #320 | Tragic 14.6% |
| Cheyenne | 0.0 /100 | #321 | Tragic 14.6% |
| Trinidadians and Tobagonians | 0.0 /100 | #322 | Tragic 14.6% |
| Immigrants | Trinidad and Tobago | 0.0 /100 | #323 | Tragic 14.6% |
| Immigrants | Jamaica | 0.0 /100 | #324 | Tragic 14.8% |
| Alaska Natives | 0.0 /100 | #325 | Tragic 14.9% |
| Immigrants | Barbados | 0.0 /100 | #326 | Tragic 15.2% |
| British West Indians | 0.0 /100 | #327 | Tragic 15.5% |
Demographics Similar to Puget Sound Salish by Unemployment Among Youth under 25 years
In terms of unemployment among youth under 25 years, the demographic groups most similar to Puget Sound Salish are Nepalese (12.5%, a difference of 0.10%), Cree (12.4%, a difference of 0.47%), Immigrants from Mexico (12.4%, a difference of 0.56%), Immigrants from El Salvador (12.4%, a difference of 0.61%), and Immigrants from Panama (12.4%, a difference of 0.63%).
| Demographics | Rating | Rank | Unemployment Among Youth under 25 years |
| Panamanians | 0.2 /100 | #257 | Tragic 12.4% |
| Salvadorans | 0.1 /100 | #258 | Tragic 12.4% |
| Immigrants | Central America | 0.1 /100 | #259 | Tragic 12.4% |
| Immigrants | Panama | 0.1 /100 | #260 | Tragic 12.4% |
| Immigrants | El Salvador | 0.1 /100 | #261 | Tragic 12.4% |
| Immigrants | Mexico | 0.1 /100 | #262 | Tragic 12.4% |
| Cree | 0.1 /100 | #263 | Tragic 12.4% |
| Puget Sound Salish | 0.1 /100 | #264 | Tragic 12.5% |
| Nepalese | 0.0 /100 | #265 | Tragic 12.5% |
| Immigrants | Latin America | 0.0 /100 | #266 | Tragic 12.6% |
| Sub-Saharan Africans | 0.0 /100 | #267 | Tragic 12.6% |
| Tlingit-Haida | 0.0 /100 | #268 | Tragic 12.7% |
| Kiowa | 0.0 /100 | #269 | Tragic 12.7% |
| Immigrants | Liberia | 0.0 /100 | #270 | Tragic 12.8% |
| Immigrants | Bahamas | 0.0 /100 | #271 | Tragic 12.9% |