Barbadian vs Spanish American Indian Vision Disability
COMPARE
Barbadian
Spanish American Indian
Vision Disability
Vision Disability Comparison
Barbadians
Spanish American Indians
2.3%
VISION DISABILITY
5.1/ 100
METRIC RATING
217th/ 347
METRIC RANK
2.6%
VISION DISABILITY
0.0/ 100
METRIC RATING
302nd/ 347
METRIC RANK
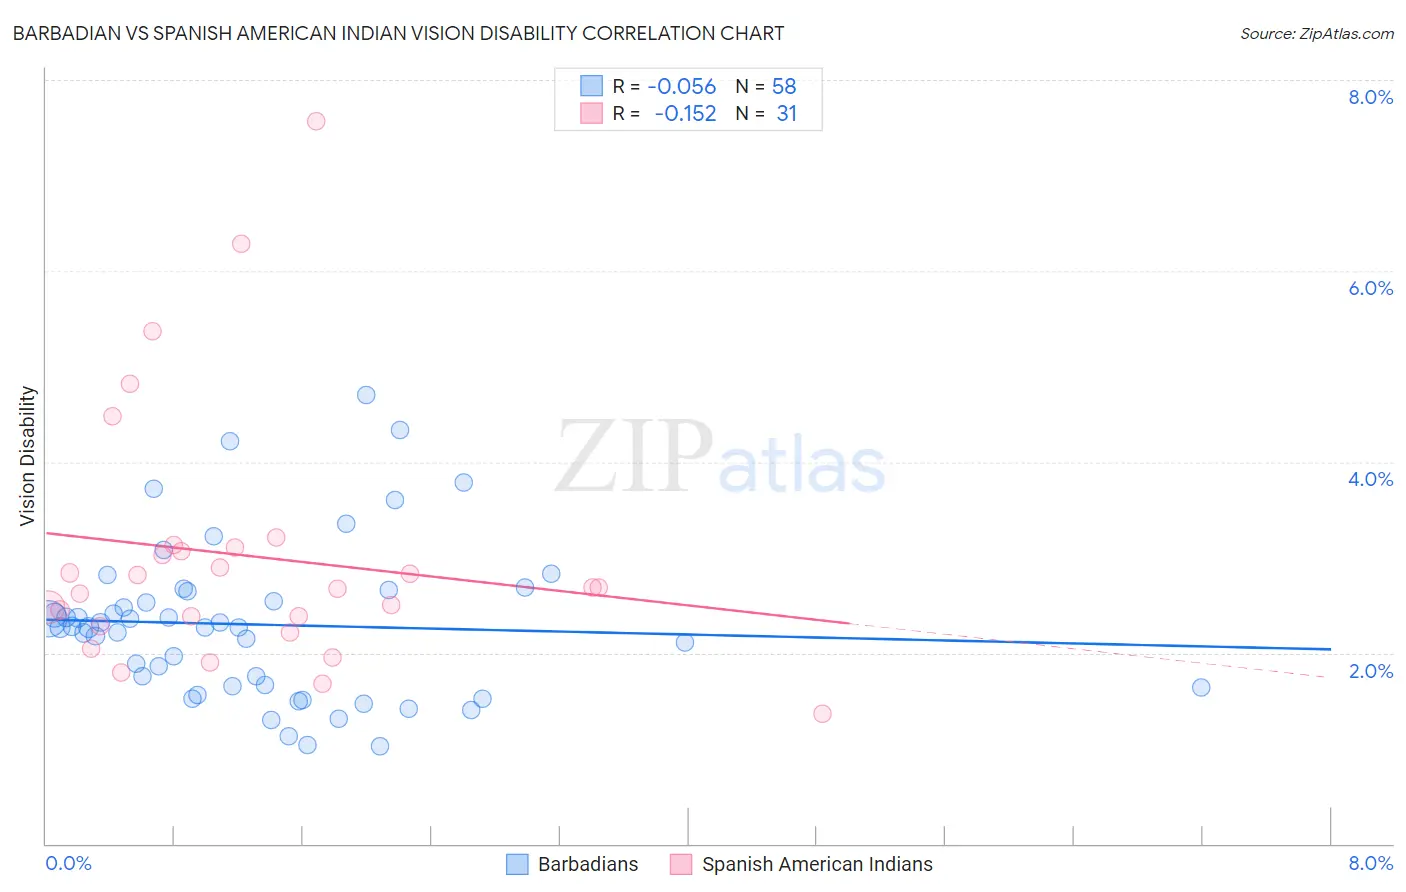
Barbadian vs Spanish American Indian Vision Disability Correlation Chart
The statistical analysis conducted on geographies consisting of 141,266,636 people shows a slight negative correlation between the proportion of Barbadians and percentage of population with vision disability in the United States with a correlation coefficient (R) of -0.056 and weighted average of 2.3%. Similarly, the statistical analysis conducted on geographies consisting of 73,139,159 people shows a poor negative correlation between the proportion of Spanish American Indians and percentage of population with vision disability in the United States with a correlation coefficient (R) of -0.152 and weighted average of 2.6%, a difference of 13.7%.
Vision Disability Correlation Summary
| Measurement | Barbadian | Spanish American Indian |
| Minimum | 1.0% | 1.4% |
| Maximum | 4.7% | 7.6% |
| Range | 3.7% | 6.2% |
| Mean | 2.3% | 3.0% |
| Median | 2.3% | 2.7% |
| Interquartile 25% (IQ1) | 1.6% | 2.3% |
| Interquartile 75% (IQ3) | 2.6% | 3.1% |
| Interquartile Range (IQR) | 1.0% | 0.83% |
| Standard Deviation (Sample) | 0.81% | 1.4% |
| Standard Deviation (Population) | 0.81% | 1.3% |
Similar Demographics by Vision Disability
Demographics Similar to Barbadians by Vision Disability
In terms of vision disability, the demographic groups most similar to Barbadians are Portuguese (2.3%, a difference of 0.070%), Ecuadorian (2.3%, a difference of 0.17%), Immigrants from Trinidad and Tobago (2.3%, a difference of 0.28%), Guamanian/Chamorro (2.3%, a difference of 0.41%), and French Canadian (2.3%, a difference of 0.43%).
| Demographics | Rating | Rank | Vision Disability |
| Immigrants | Uruguay | 11.5 /100 | #210 | Poor 2.2% |
| Indonesians | 9.5 /100 | #211 | Tragic 2.2% |
| Bermudans | 9.0 /100 | #212 | Tragic 2.2% |
| Immigrants | Ghana | 8.9 /100 | #213 | Tragic 2.2% |
| Trinidadians and Tobagonians | 8.2 /100 | #214 | Tragic 2.2% |
| Nigerians | 7.2 /100 | #215 | Tragic 2.3% |
| Immigrants | Trinidad and Tobago | 6.1 /100 | #216 | Tragic 2.3% |
| Barbadians | 5.1 /100 | #217 | Tragic 2.3% |
| Portuguese | 4.9 /100 | #218 | Tragic 2.3% |
| Ecuadorians | 4.6 /100 | #219 | Tragic 2.3% |
| Guamanians/Chamorros | 3.9 /100 | #220 | Tragic 2.3% |
| French Canadians | 3.9 /100 | #221 | Tragic 2.3% |
| Immigrants | Senegal | 3.8 /100 | #222 | Tragic 2.3% |
| Basques | 3.5 /100 | #223 | Tragic 2.3% |
| Irish | 3.4 /100 | #224 | Tragic 2.3% |
Demographics Similar to Spanish American Indians by Vision Disability
In terms of vision disability, the demographic groups most similar to Spanish American Indians are Immigrants from Cabo Verde (2.6%, a difference of 0.22%), Aleut (2.6%, a difference of 0.36%), Hispanic or Latino (2.6%, a difference of 0.66%), Menominee (2.5%, a difference of 1.3%), and Iroquois (2.6%, a difference of 1.3%).
| Demographics | Rating | Rank | Vision Disability |
| Delaware | 0.0 /100 | #295 | Tragic 2.5% |
| Immigrants | Mexico | 0.0 /100 | #296 | Tragic 2.5% |
| Immigrants | Dominica | 0.0 /100 | #297 | Tragic 2.5% |
| Mexicans | 0.0 /100 | #298 | Tragic 2.5% |
| Cree | 0.0 /100 | #299 | Tragic 2.5% |
| Africans | 0.0 /100 | #300 | Tragic 2.5% |
| Menominee | 0.0 /100 | #301 | Tragic 2.5% |
| Spanish American Indians | 0.0 /100 | #302 | Tragic 2.6% |
| Immigrants | Cabo Verde | 0.0 /100 | #303 | Tragic 2.6% |
| Aleuts | 0.0 /100 | #304 | Tragic 2.6% |
| Hispanics or Latinos | 0.0 /100 | #305 | Tragic 2.6% |
| Iroquois | 0.0 /100 | #306 | Tragic 2.6% |
| Immigrants | Dominican Republic | 0.0 /100 | #307 | Tragic 2.6% |
| Arapaho | 0.0 /100 | #308 | Tragic 2.6% |
| Immigrants | Yemen | 0.0 /100 | #309 | Tragic 2.6% |