Pakistani vs Albanian Female Disability
COMPARE
Pakistani
Albanian
Female Disability
Female Disability Comparison
Pakistanis
Albanians
12.0%
FEMALE DISABILITY
84.6/ 100
METRIC RATING
146th/ 347
METRIC RANK
12.3%
FEMALE DISABILITY
37.9/ 100
METRIC RATING
180th/ 347
METRIC RANK
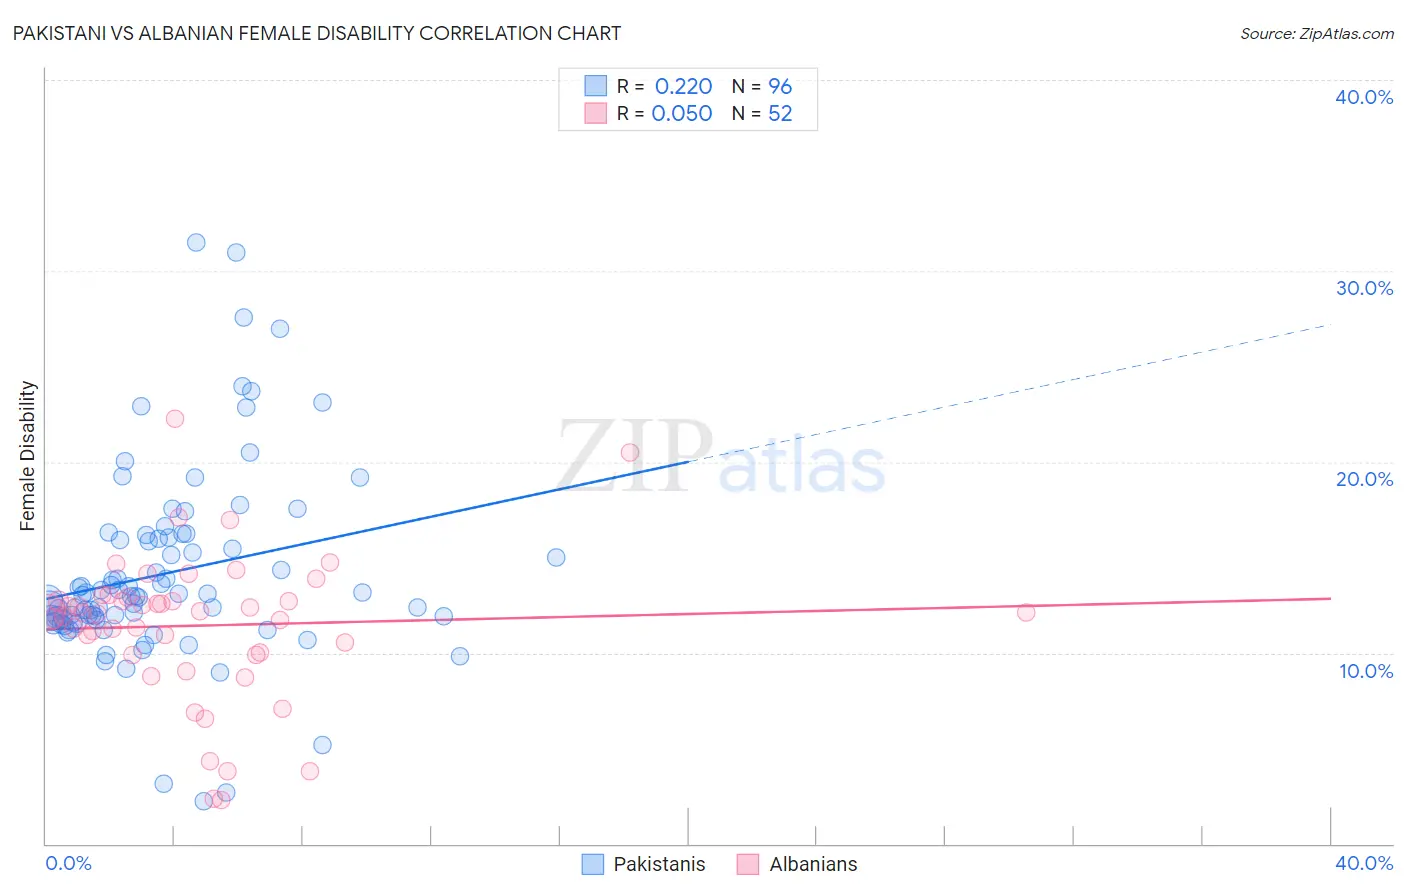
Pakistani vs Albanian Female Disability Correlation Chart
The statistical analysis conducted on geographies consisting of 335,294,894 people shows a weak positive correlation between the proportion of Pakistanis and percentage of females with a disability in the United States with a correlation coefficient (R) of 0.220 and weighted average of 12.0%. Similarly, the statistical analysis conducted on geographies consisting of 193,264,096 people shows no correlation between the proportion of Albanians and percentage of females with a disability in the United States with a correlation coefficient (R) of 0.050 and weighted average of 12.3%, a difference of 2.1%.
Female Disability Correlation Summary
| Measurement | Pakistani | Albanian |
| Minimum | 2.2% | 2.3% |
| Maximum | 31.5% | 22.2% |
| Range | 29.3% | 20.0% |
| Mean | 14.2% | 11.4% |
| Median | 13.0% | 12.1% |
| Interquartile 25% (IQ1) | 11.7% | 10.0% |
| Interquartile 75% (IQ3) | 16.0% | 12.8% |
| Interquartile Range (IQR) | 4.3% | 2.8% |
| Standard Deviation (Sample) | 5.0% | 3.9% |
| Standard Deviation (Population) | 5.0% | 3.8% |
Similar Demographics by Female Disability
Demographics Similar to Pakistanis by Female Disability
In terms of female disability, the demographic groups most similar to Pakistanis are Nigerian (12.0%, a difference of 0.040%), Immigrants from Kenya (12.0%, a difference of 0.11%), Greek (12.0%, a difference of 0.18%), Immigrants from Moldova (12.0%, a difference of 0.21%), and Estonian (12.0%, a difference of 0.26%).
| Demographics | Rating | Rank | Female Disability |
| Immigrants | Hungary | 92.8 /100 | #139 | Exceptional 11.9% |
| Romanians | 91.6 /100 | #140 | Exceptional 11.9% |
| Immigrants | Ecuador | 91.5 /100 | #141 | Exceptional 11.9% |
| Immigrants | Africa | 90.0 /100 | #142 | Excellent 11.9% |
| Immigrants | Sudan | 89.6 /100 | #143 | Excellent 11.9% |
| Immigrants | Austria | 87.9 /100 | #144 | Excellent 12.0% |
| Estonians | 87.8 /100 | #145 | Excellent 12.0% |
| Pakistanis | 84.6 /100 | #146 | Excellent 12.0% |
| Nigerians | 84.0 /100 | #147 | Excellent 12.0% |
| Immigrants | Kenya | 83.1 /100 | #148 | Excellent 12.0% |
| Greeks | 82.0 /100 | #149 | Excellent 12.0% |
| Immigrants | Moldova | 81.4 /100 | #150 | Excellent 12.0% |
| Icelanders | 80.7 /100 | #151 | Excellent 12.0% |
| Immigrants | Scotland | 79.3 /100 | #152 | Good 12.0% |
| Sudanese | 79.1 /100 | #153 | Good 12.0% |
Demographics Similar to Albanians by Female Disability
In terms of female disability, the demographic groups most similar to Albanians are Immigrants from Fiji (12.3%, a difference of 0.010%), Immigrants from Canada (12.3%, a difference of 0.030%), Norwegian (12.3%, a difference of 0.040%), Cuban (12.3%, a difference of 0.060%), and Iraqi (12.3%, a difference of 0.080%).
| Demographics | Rating | Rank | Female Disability |
| Immigrants | Mexico | 50.8 /100 | #173 | Average 12.2% |
| Immigrants | England | 50.0 /100 | #174 | Average 12.2% |
| Immigrants | St. Vincent and the Grenadines | 49.7 /100 | #175 | Average 12.2% |
| Immigrants | Guyana | 43.1 /100 | #176 | Average 12.2% |
| Immigrants | Ghana | 42.5 /100 | #177 | Average 12.2% |
| Immigrants | Western Europe | 40.9 /100 | #178 | Average 12.2% |
| Immigrants | Fiji | 38.2 /100 | #179 | Fair 12.3% |
| Albanians | 37.9 /100 | #180 | Fair 12.3% |
| Immigrants | Canada | 37.2 /100 | #181 | Fair 12.3% |
| Norwegians | 36.9 /100 | #182 | Fair 12.3% |
| Cubans | 36.5 /100 | #183 | Fair 12.3% |
| Iraqis | 36.0 /100 | #184 | Fair 12.3% |
| Immigrants | Uzbekistan | 33.9 /100 | #185 | Fair 12.3% |
| Austrians | 33.3 /100 | #186 | Fair 12.3% |
| Serbians | 33.1 /100 | #187 | Fair 12.3% |