Immigrants vs Comanche Disability Age 35 to 64
COMPARE
Immigrants
Comanche
Disability Age 35 to 64
Disability Age 35 to 64 Comparison
Immigrants
Comanche
10.7%
DISABILITY AGE 35 TO 64
92.5/ 100
METRIC RATING
133rd/ 347
METRIC RANK
14.7%
DISABILITY AGE 35 TO 64
0.0/ 100
METRIC RATING
321st/ 347
METRIC RANK
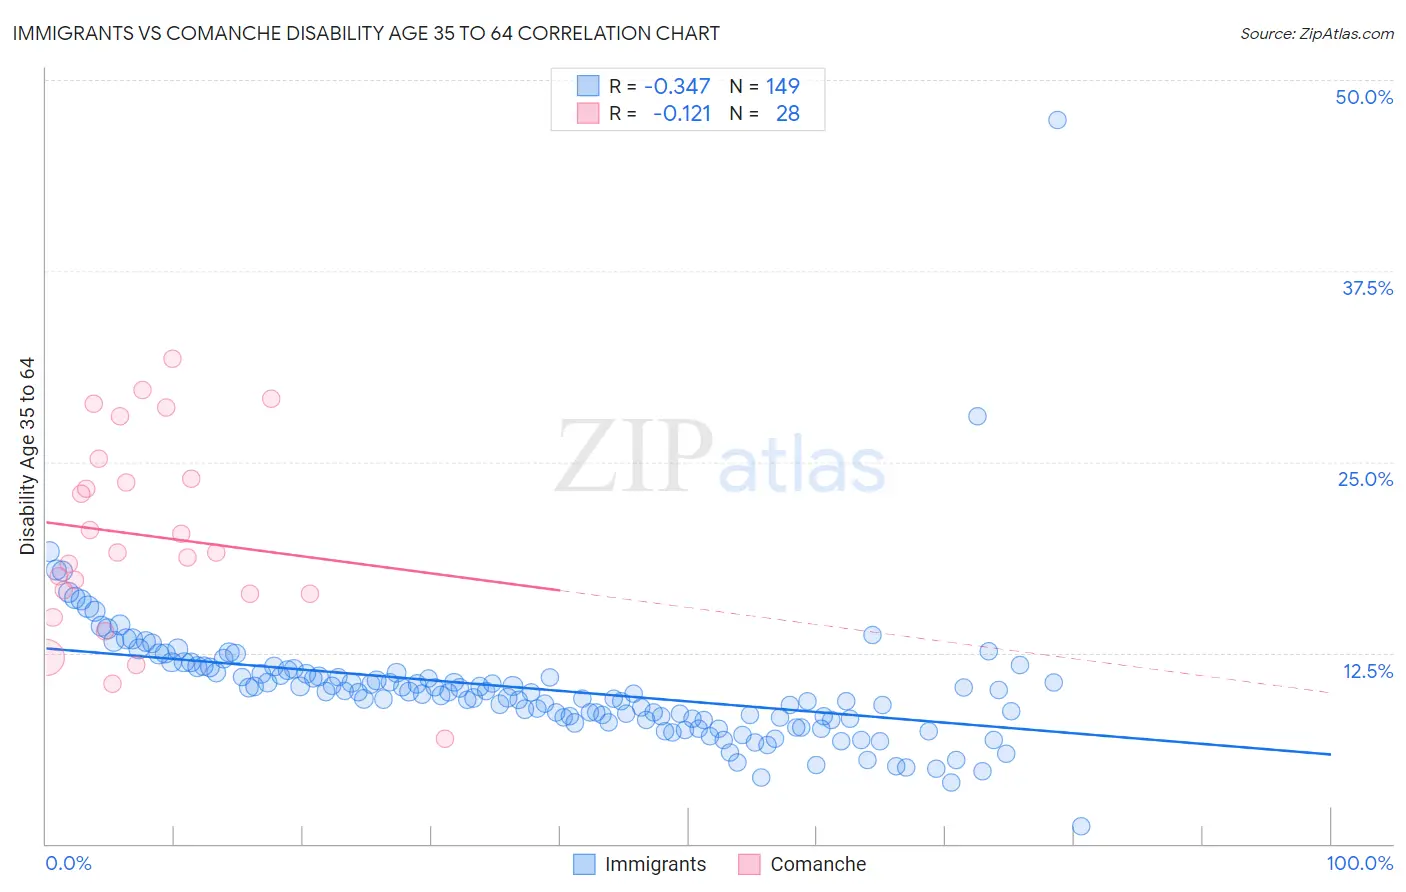
Immigrants vs Comanche Disability Age 35 to 64 Correlation Chart
The statistical analysis conducted on geographies consisting of 576,523,974 people shows a mild negative correlation between the proportion of Immigrants and percentage of population with a disability between the ages 34 and 64 in the United States with a correlation coefficient (R) of -0.347 and weighted average of 10.7%. Similarly, the statistical analysis conducted on geographies consisting of 109,769,309 people shows a poor negative correlation between the proportion of Comanche and percentage of population with a disability between the ages 34 and 64 in the United States with a correlation coefficient (R) of -0.121 and weighted average of 14.7%, a difference of 37.8%.
Disability Age 35 to 64 Correlation Summary
| Measurement | Immigrants | Comanche |
| Minimum | 1.1% | 6.9% |
| Maximum | 47.4% | 31.7% |
| Range | 46.2% | 24.8% |
| Mean | 10.2% | 20.2% |
| Median | 9.9% | 19.1% |
| Interquartile 25% (IQ1) | 8.1% | 16.4% |
| Interquartile 75% (IQ3) | 11.3% | 24.6% |
| Interquartile Range (IQR) | 3.1% | 8.2% |
| Standard Deviation (Sample) | 4.4% | 6.4% |
| Standard Deviation (Population) | 4.4% | 6.3% |
Similar Demographics by Disability Age 35 to 64
Demographics Similar to Immigrants by Disability Age 35 to 64
In terms of disability age 35 to 64, the demographic groups most similar to Immigrants are Immigrants from Albania (10.7%, a difference of 0.0%), Immigrants from Ecuador (10.7%, a difference of 0.0%), Greek (10.7%, a difference of 0.050%), Immigrants from El Salvador (10.7%, a difference of 0.11%), and Immigrants from Syria (10.7%, a difference of 0.16%).
| Demographics | Rating | Rank | Disability Age 35 to 64 |
| Immigrants | Afghanistan | 94.1 /100 | #126 | Exceptional 10.6% |
| Immigrants | Zimbabwe | 94.0 /100 | #127 | Exceptional 10.6% |
| South Africans | 93.3 /100 | #128 | Exceptional 10.7% |
| Ecuadorians | 93.1 /100 | #129 | Exceptional 10.7% |
| Immigrants | Syria | 93.0 /100 | #130 | Exceptional 10.7% |
| Immigrants | El Salvador | 92.8 /100 | #131 | Exceptional 10.7% |
| Immigrants | Albania | 92.5 /100 | #132 | Exceptional 10.7% |
| Immigrants | Immigrants | 92.5 /100 | #133 | Exceptional 10.7% |
| Immigrants | Ecuador | 92.5 /100 | #134 | Exceptional 10.7% |
| Greeks | 92.3 /100 | #135 | Exceptional 10.7% |
| Salvadorans | 91.9 /100 | #136 | Exceptional 10.7% |
| Immigrants | Costa Rica | 91.7 /100 | #137 | Exceptional 10.7% |
| Immigrants | Southern Europe | 91.5 /100 | #138 | Exceptional 10.7% |
| Costa Ricans | 91.4 /100 | #139 | Exceptional 10.7% |
| Immigrants | Scotland | 91.3 /100 | #140 | Exceptional 10.7% |
Demographics Similar to Comanche by Disability Age 35 to 64
In terms of disability age 35 to 64, the demographic groups most similar to Comanche are Potawatomi (14.8%, a difference of 0.040%), Black/African American (14.7%, a difference of 0.26%), Immigrants from Cabo Verde (14.7%, a difference of 0.41%), Ottawa (14.6%, a difference of 0.83%), and Crow (14.6%, a difference of 0.90%).
| Demographics | Rating | Rank | Disability Age 35 to 64 |
| Shoshone | 0.0 /100 | #314 | Tragic 14.5% |
| Alaska Natives | 0.0 /100 | #315 | Tragic 14.5% |
| Osage | 0.0 /100 | #316 | Tragic 14.5% |
| Crow | 0.0 /100 | #317 | Tragic 14.6% |
| Ottawa | 0.0 /100 | #318 | Tragic 14.6% |
| Immigrants | Cabo Verde | 0.0 /100 | #319 | Tragic 14.7% |
| Blacks/African Americans | 0.0 /100 | #320 | Tragic 14.7% |
| Comanche | 0.0 /100 | #321 | Tragic 14.7% |
| Potawatomi | 0.0 /100 | #322 | Tragic 14.8% |
| Apache | 0.0 /100 | #323 | Tragic 14.9% |
| Chippewa | 0.0 /100 | #324 | Tragic 15.0% |
| Arapaho | 0.0 /100 | #325 | Tragic 15.1% |
| Natives/Alaskans | 0.0 /100 | #326 | Tragic 15.3% |
| Pueblo | 0.0 /100 | #327 | Tragic 15.3% |
| Cajuns | 0.0 /100 | #328 | Tragic 15.3% |