Soviet Union vs Immigrants from Uzbekistan Cognitive Disability
COMPARE
Soviet Union
Immigrants from Uzbekistan
Cognitive Disability
Cognitive Disability Comparison
Soviet Union
Immigrants from Uzbekistan
16.5%
COGNITIVE DISABILITY
99.8/ 100
METRIC RATING
52nd/ 347
METRIC RANK
16.7%
COGNITIVE DISABILITY
99.4/ 100
METRIC RATING
69th/ 347
METRIC RANK
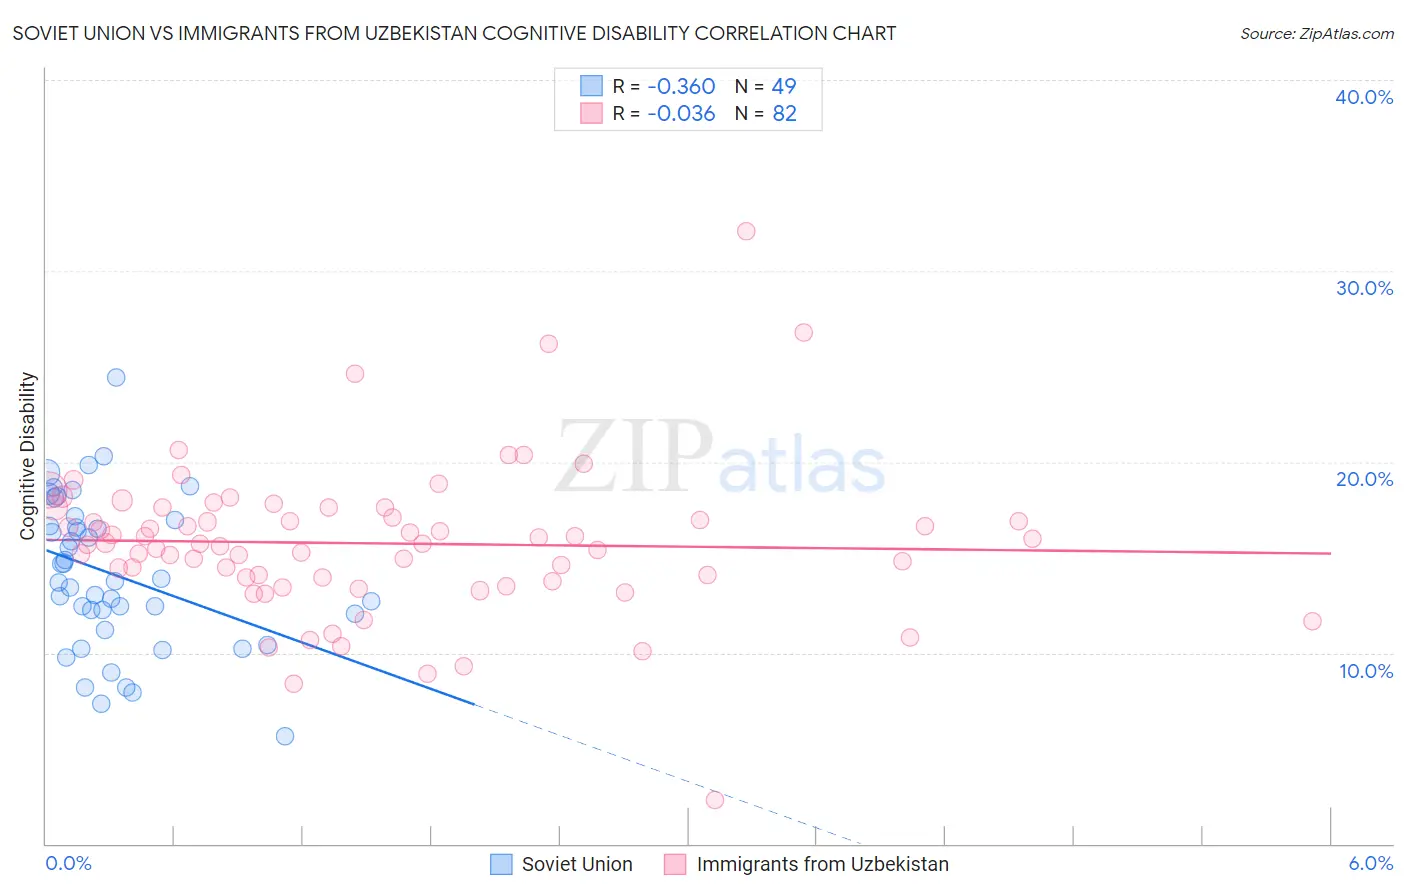
Soviet Union vs Immigrants from Uzbekistan Cognitive Disability Correlation Chart
The statistical analysis conducted on geographies consisting of 43,504,324 people shows a mild negative correlation between the proportion of Soviet Union and percentage of population with cognitive disability in the United States with a correlation coefficient (R) of -0.360 and weighted average of 16.5%. Similarly, the statistical analysis conducted on geographies consisting of 118,751,620 people shows no correlation between the proportion of Immigrants from Uzbekistan and percentage of population with cognitive disability in the United States with a correlation coefficient (R) of -0.036 and weighted average of 16.7%, a difference of 0.85%.
Cognitive Disability Correlation Summary
| Measurement | Soviet Union | Immigrants from Uzbekistan |
| Minimum | 5.6% | 2.3% |
| Maximum | 24.4% | 32.0% |
| Range | 18.8% | 29.7% |
| Mean | 14.1% | 15.7% |
| Median | 13.7% | 15.7% |
| Interquartile 25% (IQ1) | 11.6% | 13.9% |
| Interquartile 75% (IQ3) | 16.8% | 17.6% |
| Interquartile Range (IQR) | 5.2% | 3.7% |
| Standard Deviation (Sample) | 3.9% | 4.1% |
| Standard Deviation (Population) | 3.9% | 4.0% |
Demographics Similar to Soviet Union and Immigrants from Uzbekistan by Cognitive Disability
In terms of cognitive disability, the demographic groups most similar to Soviet Union are Immigrants from Korea (16.5%, a difference of 0.040%), Swedish (16.5%, a difference of 0.060%), Norwegian (16.5%, a difference of 0.090%), Immigrants from Iran (16.5%, a difference of 0.10%), and Immigrants from Venezuela (16.5%, a difference of 0.19%). Similarly, the demographic groups most similar to Immigrants from Uzbekistan are Immigrants from Sweden (16.7%, a difference of 0.010%), Ukrainian (16.6%, a difference of 0.080%), Latvian (16.6%, a difference of 0.12%), Immigrants from Ukraine (16.6%, a difference of 0.16%), and Colombian (16.6%, a difference of 0.28%).
| Demographics | Rating | Rank | Cognitive Disability |
| Norwegians | 99.8 /100 | #50 | Exceptional 16.5% |
| Immigrants | Korea | 99.8 /100 | #51 | Exceptional 16.5% |
| Soviet Union | 99.8 /100 | #52 | Exceptional 16.5% |
| Swedes | 99.8 /100 | #53 | Exceptional 16.5% |
| Immigrants | Iran | 99.8 /100 | #54 | Exceptional 16.5% |
| Immigrants | Venezuela | 99.7 /100 | #55 | Exceptional 16.5% |
| Austrians | 99.7 /100 | #56 | Exceptional 16.6% |
| Bhutanese | 99.7 /100 | #57 | Exceptional 16.6% |
| Pennsylvania Germans | 99.7 /100 | #58 | Exceptional 16.6% |
| Immigrants | Peru | 99.7 /100 | #59 | Exceptional 16.6% |
| Romanians | 99.7 /100 | #60 | Exceptional 16.6% |
| Immigrants | England | 99.6 /100 | #61 | Exceptional 16.6% |
| Czechoslovakians | 99.6 /100 | #62 | Exceptional 16.6% |
| Argentineans | 99.6 /100 | #63 | Exceptional 16.6% |
| Venezuelans | 99.6 /100 | #64 | Exceptional 16.6% |
| Colombians | 99.6 /100 | #65 | Exceptional 16.6% |
| Immigrants | Ukraine | 99.5 /100 | #66 | Exceptional 16.6% |
| Latvians | 99.5 /100 | #67 | Exceptional 16.6% |
| Ukrainians | 99.4 /100 | #68 | Exceptional 16.6% |
| Immigrants | Uzbekistan | 99.4 /100 | #69 | Exceptional 16.7% |
| Immigrants | Sweden | 99.4 /100 | #70 | Exceptional 16.7% |