Panamanian vs Immigrants from Uzbekistan Cognitive Disability
COMPARE
Panamanian
Immigrants from Uzbekistan
Cognitive Disability
Cognitive Disability Comparison
Panamanians
Immigrants from Uzbekistan
17.8%
COGNITIVE DISABILITY
2.1/ 100
METRIC RATING
233rd/ 347
METRIC RANK
16.7%
COGNITIVE DISABILITY
99.4/ 100
METRIC RATING
69th/ 347
METRIC RANK
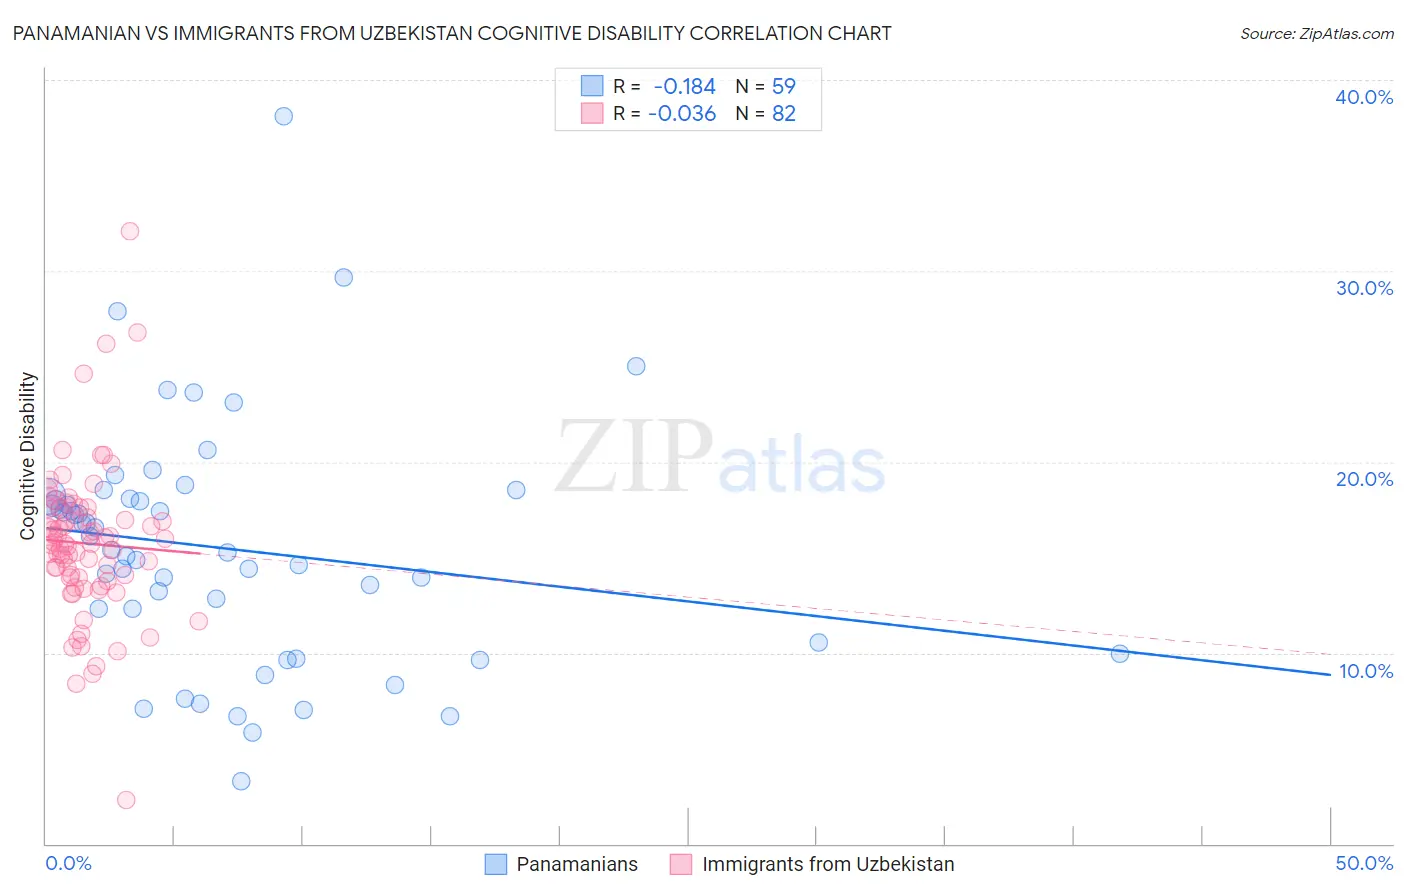
Panamanian vs Immigrants from Uzbekistan Cognitive Disability Correlation Chart
The statistical analysis conducted on geographies consisting of 281,192,320 people shows a poor negative correlation between the proportion of Panamanians and percentage of population with cognitive disability in the United States with a correlation coefficient (R) of -0.184 and weighted average of 17.8%. Similarly, the statistical analysis conducted on geographies consisting of 118,751,620 people shows no correlation between the proportion of Immigrants from Uzbekistan and percentage of population with cognitive disability in the United States with a correlation coefficient (R) of -0.036 and weighted average of 16.7%, a difference of 6.6%.
Cognitive Disability Correlation Summary
| Measurement | Panamanian | Immigrants from Uzbekistan |
| Minimum | 3.3% | 2.3% |
| Maximum | 38.1% | 32.0% |
| Range | 34.8% | 29.7% |
| Mean | 15.5% | 15.7% |
| Median | 15.4% | 15.7% |
| Interquartile 25% (IQ1) | 10.5% | 13.9% |
| Interquartile 75% (IQ3) | 18.1% | 17.6% |
| Interquartile Range (IQR) | 7.5% | 3.7% |
| Standard Deviation (Sample) | 6.3% | 4.1% |
| Standard Deviation (Population) | 6.2% | 4.0% |
Similar Demographics by Cognitive Disability
Demographics Similar to Panamanians by Cognitive Disability
In terms of cognitive disability, the demographic groups most similar to Panamanians are Guatemalan (17.8%, a difference of 0.0%), Tongan (17.8%, a difference of 0.0%), Osage (17.8%, a difference of 0.020%), Spanish American Indian (17.8%, a difference of 0.020%), and Mongolian (17.7%, a difference of 0.040%).
| Demographics | Rating | Rank | Cognitive Disability |
| Marshallese | 2.7 /100 | #226 | Tragic 17.7% |
| Immigrants | St. Vincent and the Grenadines | 2.6 /100 | #227 | Tragic 17.7% |
| Immigrants | Central America | 2.3 /100 | #228 | Tragic 17.7% |
| Immigrants | Guatemala | 2.2 /100 | #229 | Tragic 17.7% |
| Mongolians | 2.2 /100 | #230 | Tragic 17.7% |
| Guatemalans | 2.1 /100 | #231 | Tragic 17.8% |
| Tongans | 2.1 /100 | #232 | Tragic 17.8% |
| Panamanians | 2.1 /100 | #233 | Tragic 17.8% |
| Osage | 2.0 /100 | #234 | Tragic 17.8% |
| Spanish American Indians | 2.0 /100 | #235 | Tragic 17.8% |
| Immigrants | Iraq | 1.8 /100 | #236 | Tragic 17.8% |
| Immigrants | Mexico | 1.8 /100 | #237 | Tragic 17.8% |
| Cheyenne | 1.7 /100 | #238 | Tragic 17.8% |
| Cajuns | 1.4 /100 | #239 | Tragic 17.8% |
| Iraqis | 1.4 /100 | #240 | Tragic 17.8% |
Demographics Similar to Immigrants from Uzbekistan by Cognitive Disability
In terms of cognitive disability, the demographic groups most similar to Immigrants from Uzbekistan are Immigrants from Sweden (16.7%, a difference of 0.010%), Immigrants from Belgium (16.7%, a difference of 0.020%), German (16.7%, a difference of 0.040%), Burmese (16.7%, a difference of 0.040%), and Slavic (16.7%, a difference of 0.050%).
| Demographics | Rating | Rank | Cognitive Disability |
| Czechoslovakians | 99.6 /100 | #62 | Exceptional 16.6% |
| Argentineans | 99.6 /100 | #63 | Exceptional 16.6% |
| Venezuelans | 99.6 /100 | #64 | Exceptional 16.6% |
| Colombians | 99.6 /100 | #65 | Exceptional 16.6% |
| Immigrants | Ukraine | 99.5 /100 | #66 | Exceptional 16.6% |
| Latvians | 99.5 /100 | #67 | Exceptional 16.6% |
| Ukrainians | 99.4 /100 | #68 | Exceptional 16.6% |
| Immigrants | Uzbekistan | 99.4 /100 | #69 | Exceptional 16.7% |
| Immigrants | Sweden | 99.4 /100 | #70 | Exceptional 16.7% |
| Immigrants | Belgium | 99.3 /100 | #71 | Exceptional 16.7% |
| Germans | 99.3 /100 | #72 | Exceptional 16.7% |
| Burmese | 99.3 /100 | #73 | Exceptional 16.7% |
| Slavs | 99.3 /100 | #74 | Exceptional 16.7% |
| Estonians | 99.3 /100 | #75 | Exceptional 16.7% |
| Immigrants | Serbia | 99.3 /100 | #76 | Exceptional 16.7% |