Austrian vs Immigrants from Jordan 4th Grade
COMPARE
Austrian
Immigrants from Jordan
4th Grade
4th Grade Comparison
Austrians
Immigrants from Jordan
98.1%
4TH GRADE
99.8/ 100
METRIC RATING
57th/ 347
METRIC RANK
97.6%
4TH GRADE
66.9/ 100
METRIC RATING
156th/ 347
METRIC RANK
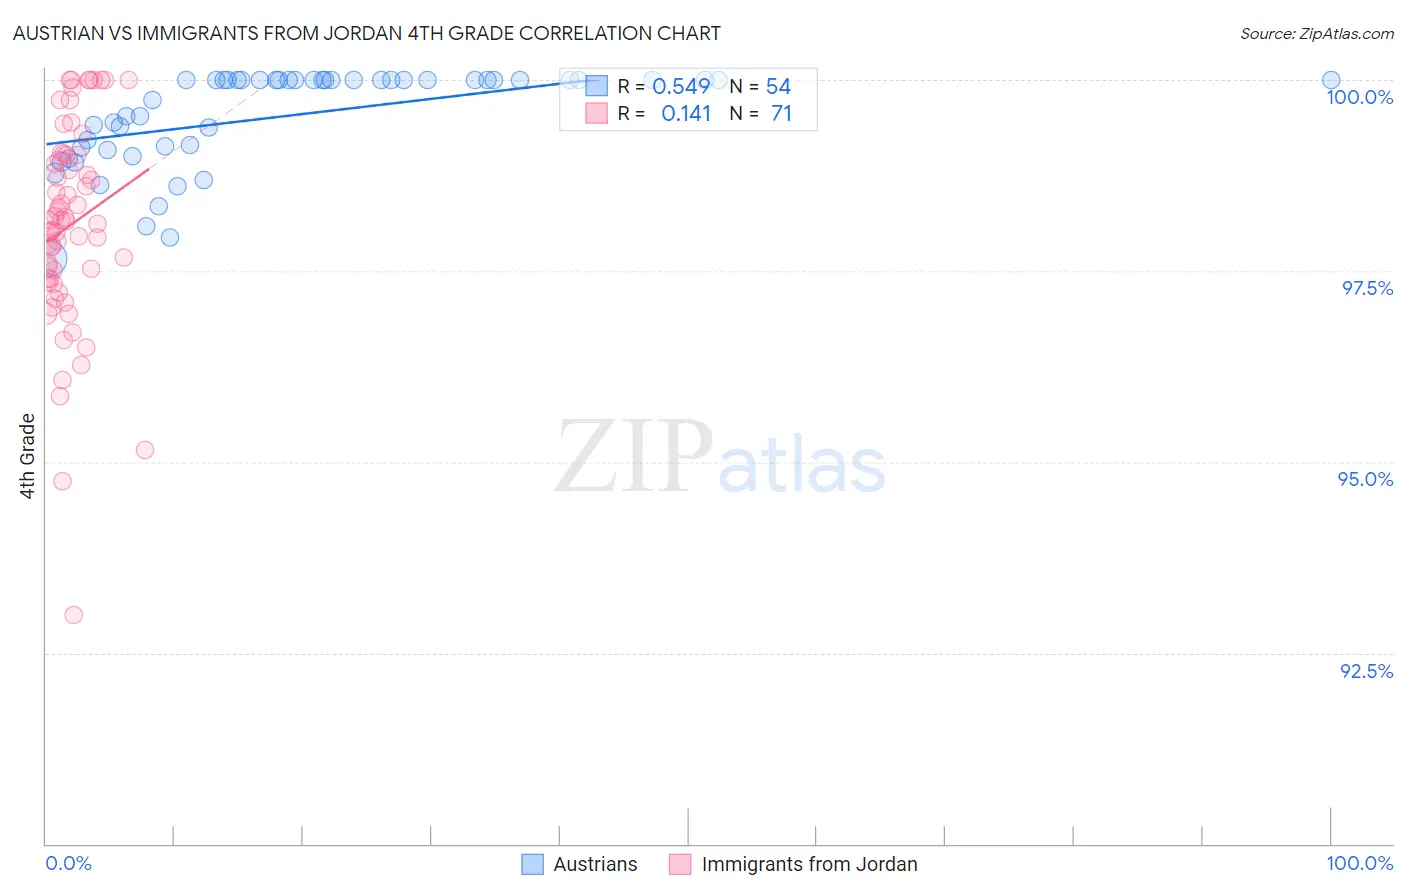
Austrian vs Immigrants from Jordan 4th Grade Correlation Chart
The statistical analysis conducted on geographies consisting of 452,080,536 people shows a substantial positive correlation between the proportion of Austrians and percentage of population with at least 4th grade education in the United States with a correlation coefficient (R) of 0.549 and weighted average of 98.1%. Similarly, the statistical analysis conducted on geographies consisting of 181,269,915 people shows a poor positive correlation between the proportion of Immigrants from Jordan and percentage of population with at least 4th grade education in the United States with a correlation coefficient (R) of 0.141 and weighted average of 97.6%, a difference of 0.51%.
4th Grade Correlation Summary
| Measurement | Austrian | Immigrants from Jordan |
| Minimum | 97.7% | 93.0% |
| Maximum | 100.0% | 100.0% |
| Range | 2.3% | 7.0% |
| Mean | 99.5% | 98.1% |
| Median | 100.0% | 98.2% |
| Interquartile 25% (IQ1) | 99.1% | 97.4% |
| Interquartile 75% (IQ3) | 100.0% | 99.0% |
| Interquartile Range (IQR) | 0.89% | 1.6% |
| Standard Deviation (Sample) | 0.63% | 1.3% |
| Standard Deviation (Population) | 0.63% | 1.3% |
Similar Demographics by 4th Grade
Demographics Similar to Austrians by 4th Grade
In terms of 4th grade, the demographic groups most similar to Austrians are Maltese (98.1%, a difference of 0.0%), White/Caucasian (98.1%, a difference of 0.0%), Greek (98.1%, a difference of 0.0%), Creek (98.1%, a difference of 0.0%), and Celtic (98.1%, a difference of 0.010%).
| Demographics | Rating | Rank | 4th Grade |
| Immigrants | Scotland | 99.8 /100 | #50 | Exceptional 98.1% |
| Celtics | 99.8 /100 | #51 | Exceptional 98.1% |
| Australians | 99.8 /100 | #52 | Exceptional 98.1% |
| Slavs | 99.8 /100 | #53 | Exceptional 98.1% |
| Maltese | 99.8 /100 | #54 | Exceptional 98.1% |
| Whites/Caucasians | 99.8 /100 | #55 | Exceptional 98.1% |
| Greeks | 99.8 /100 | #56 | Exceptional 98.1% |
| Austrians | 99.8 /100 | #57 | Exceptional 98.1% |
| Creek | 99.8 /100 | #58 | Exceptional 98.1% |
| Americans | 99.8 /100 | #59 | Exceptional 98.1% |
| Immigrants | Canada | 99.7 /100 | #60 | Exceptional 98.1% |
| Immigrants | North America | 99.7 /100 | #61 | Exceptional 98.1% |
| Serbians | 99.7 /100 | #62 | Exceptional 98.1% |
| Russians | 99.7 /100 | #63 | Exceptional 98.0% |
| Cajuns | 99.7 /100 | #64 | Exceptional 98.0% |
Demographics Similar to Immigrants from Jordan by 4th Grade
In terms of 4th grade, the demographic groups most similar to Immigrants from Jordan are Immigrants from Russia (97.6%, a difference of 0.0%), Albanian (97.6%, a difference of 0.0%), Immigrants from Bosnia and Herzegovina (97.6%, a difference of 0.0%), French American Indian (97.6%, a difference of 0.0%), and Immigrants from Italy (97.6%, a difference of 0.010%).
| Demographics | Rating | Rank | 4th Grade |
| Soviet Union | 77.8 /100 | #149 | Good 97.6% |
| Immigrants | Israel | 77.7 /100 | #150 | Good 97.6% |
| Alsatians | 77.2 /100 | #151 | Good 97.6% |
| Immigrants | South Central Asia | 76.2 /100 | #152 | Good 97.6% |
| Immigrants | Eastern Europe | 71.3 /100 | #153 | Good 97.6% |
| Immigrants | Russia | 67.0 /100 | #154 | Good 97.6% |
| Albanians | 67.0 /100 | #155 | Good 97.6% |
| Immigrants | Jordan | 66.9 /100 | #156 | Good 97.6% |
| Immigrants | Bosnia and Herzegovina | 66.0 /100 | #157 | Good 97.6% |
| French American Indians | 65.9 /100 | #158 | Good 97.6% |
| Immigrants | Italy | 63.7 /100 | #159 | Good 97.6% |
| Apache | 61.3 /100 | #160 | Good 97.6% |
| Marshallese | 60.8 /100 | #161 | Good 97.6% |
| Bermudans | 60.5 /100 | #162 | Good 97.6% |
| Immigrants | Iran | 60.3 /100 | #163 | Good 97.6% |