Austrian vs Immigrants from Jordan 1st Grade
COMPARE
Austrian
Immigrants from Jordan
1st Grade
1st Grade Comparison
Austrians
Immigrants from Jordan
98.4%
1ST GRADE
99.8/ 100
METRIC RATING
57th/ 347
METRIC RANK
97.9%
1ST GRADE
53.9/ 100
METRIC RATING
171st/ 347
METRIC RANK
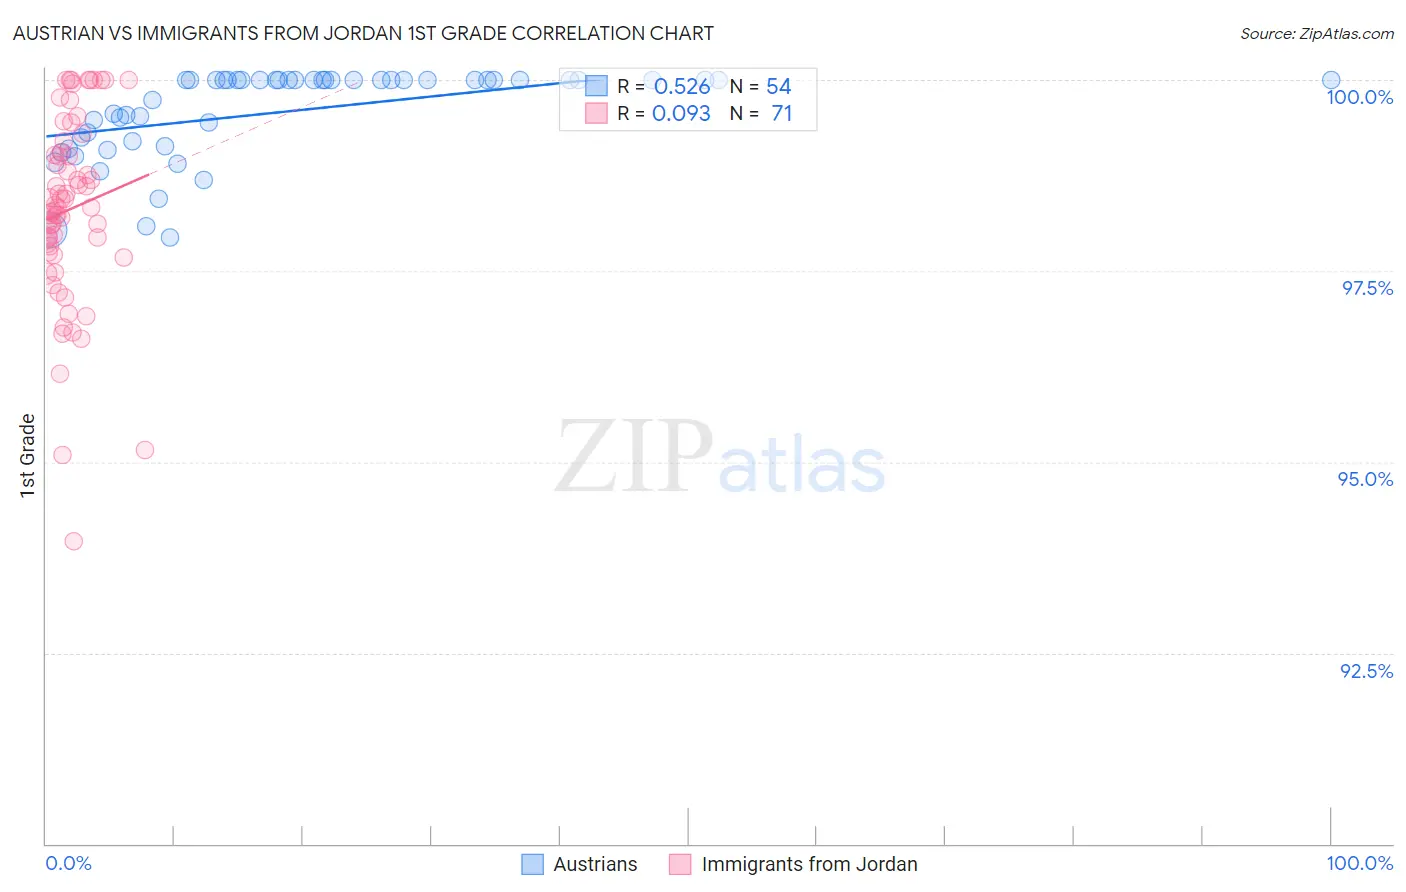
Austrian vs Immigrants from Jordan 1st Grade Correlation Chart
The statistical analysis conducted on geographies consisting of 452,080,536 people shows a substantial positive correlation between the proportion of Austrians and percentage of population with at least 1st grade education in the United States with a correlation coefficient (R) of 0.526 and weighted average of 98.4%. Similarly, the statistical analysis conducted on geographies consisting of 181,269,915 people shows a slight positive correlation between the proportion of Immigrants from Jordan and percentage of population with at least 1st grade education in the United States with a correlation coefficient (R) of 0.093 and weighted average of 97.9%, a difference of 0.46%.
1st Grade Correlation Summary
| Measurement | Austrian | Immigrants from Jordan |
| Minimum | 97.9% | 94.0% |
| Maximum | 100.0% | 100.0% |
| Range | 2.1% | 6.0% |
| Mean | 99.6% | 98.3% |
| Median | 100.0% | 98.3% |
| Interquartile 25% (IQ1) | 99.2% | 97.7% |
| Interquartile 75% (IQ3) | 100.0% | 99.1% |
| Interquartile Range (IQR) | 0.81% | 1.3% |
| Standard Deviation (Sample) | 0.58% | 1.2% |
| Standard Deviation (Population) | 0.58% | 1.2% |
Similar Demographics by 1st Grade
Demographics Similar to Austrians by 1st Grade
In terms of 1st grade, the demographic groups most similar to Austrians are American (98.4%, a difference of 0.0%), New Zealander (98.4%, a difference of 0.0%), Immigrants from Scotland (98.4%, a difference of 0.010%), Creek (98.4%, a difference of 0.010%), and Immigrants from Canada (98.4%, a difference of 0.010%).
| Demographics | Rating | Rank | 1st Grade |
| Whites/Caucasians | 99.8 /100 | #50 | Exceptional 98.4% |
| Estonians | 99.8 /100 | #51 | Exceptional 98.4% |
| Pueblo | 99.8 /100 | #52 | Exceptional 98.4% |
| Kiowa | 99.8 /100 | #53 | Exceptional 98.4% |
| Australians | 99.8 /100 | #54 | Exceptional 98.4% |
| Immigrants | Scotland | 99.8 /100 | #55 | Exceptional 98.4% |
| Americans | 99.8 /100 | #56 | Exceptional 98.4% |
| Austrians | 99.8 /100 | #57 | Exceptional 98.4% |
| New Zealanders | 99.7 /100 | #58 | Exceptional 98.4% |
| Creek | 99.7 /100 | #59 | Exceptional 98.4% |
| Immigrants | Canada | 99.7 /100 | #60 | Exceptional 98.4% |
| Bulgarians | 99.7 /100 | #61 | Exceptional 98.4% |
| Slavs | 99.7 /100 | #62 | Exceptional 98.4% |
| Immigrants | North America | 99.7 /100 | #63 | Exceptional 98.4% |
| Greeks | 99.7 /100 | #64 | Exceptional 98.4% |
Demographics Similar to Immigrants from Jordan by 1st Grade
In terms of 1st grade, the demographic groups most similar to Immigrants from Jordan are Immigrants from Micronesia (97.9%, a difference of 0.0%), Immigrants from Spain (97.9%, a difference of 0.0%), Immigrants from Korea (97.9%, a difference of 0.0%), Brazilian (97.9%, a difference of 0.010%), and Ugandan (97.9%, a difference of 0.010%).
| Demographics | Rating | Rank | 1st Grade |
| Brazilians | 57.6 /100 | #164 | Average 97.9% |
| Ugandans | 56.9 /100 | #165 | Average 97.9% |
| Navajo | 56.6 /100 | #166 | Average 97.9% |
| Bermudans | 56.3 /100 | #167 | Average 97.9% |
| Chileans | 55.6 /100 | #168 | Average 97.9% |
| Immigrants | Micronesia | 55.3 /100 | #169 | Average 97.9% |
| Immigrants | Spain | 54.9 /100 | #170 | Average 97.9% |
| Immigrants | Jordan | 53.9 /100 | #171 | Average 97.9% |
| Immigrants | Korea | 53.0 /100 | #172 | Average 97.9% |
| Kenyans | 51.2 /100 | #173 | Average 97.9% |
| Natives/Alaskans | 50.0 /100 | #174 | Average 97.9% |
| Immigrants | Sri Lanka | 49.7 /100 | #175 | Average 97.9% |
| Albanians | 49.6 /100 | #176 | Average 97.9% |
| Immigrants | Brazil | 49.1 /100 | #177 | Average 97.9% |
| Immigrants | Venezuela | 47.8 /100 | #178 | Average 97.9% |