Austrian vs American Median Family Income
COMPARE
Austrian
American
Median Family Income
Median Family Income Comparison
Austrians
Americans
$111,306
MEDIAN FAMILY INCOME
98.8/ 100
METRIC RATING
87th/ 347
METRIC RANK
$92,096
MEDIAN FAMILY INCOME
0.4/ 100
METRIC RATING
257th/ 347
METRIC RANK
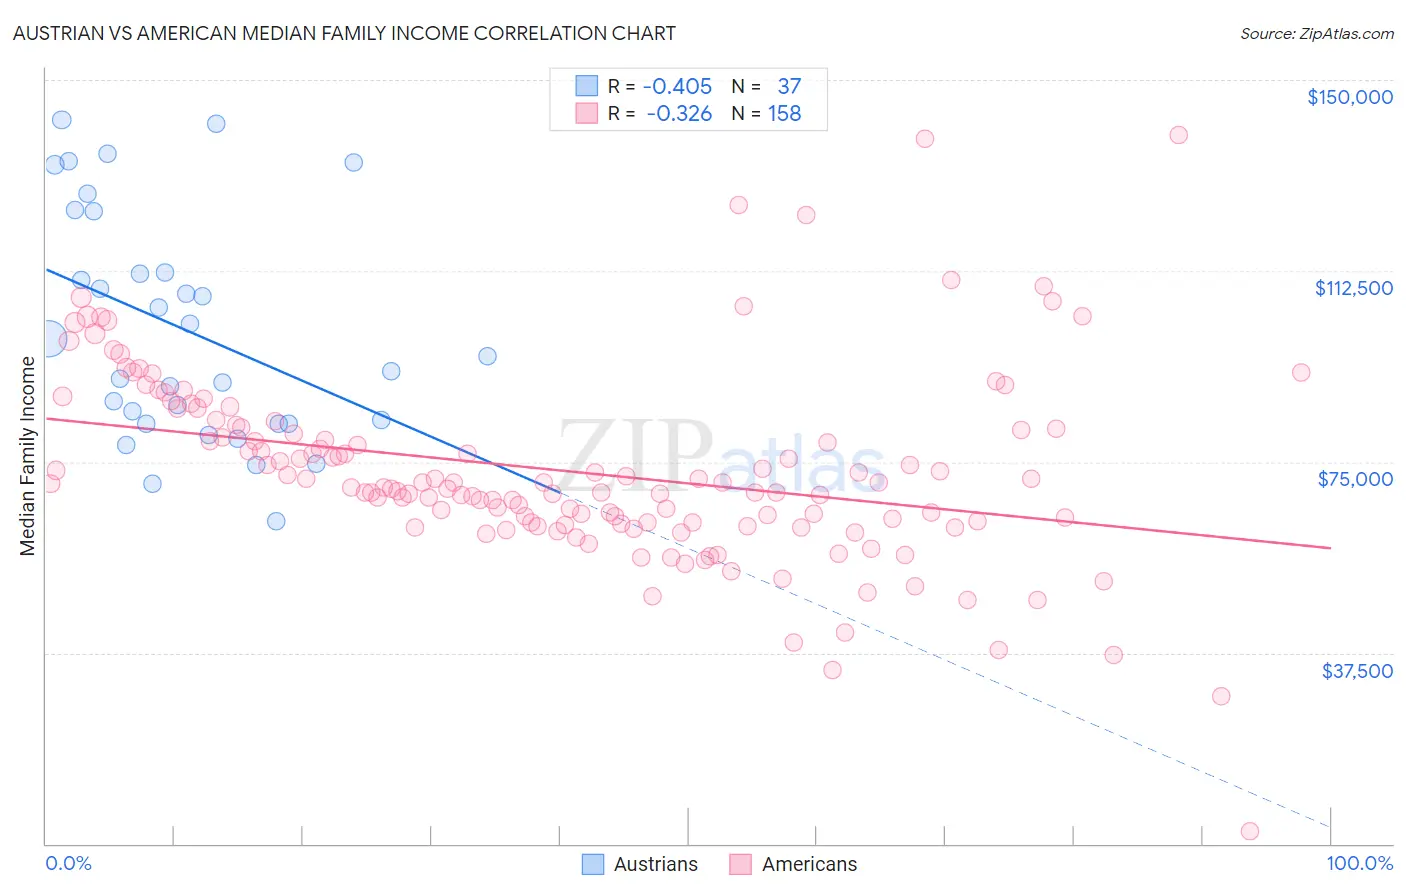
Austrian vs American Median Family Income Correlation Chart
The statistical analysis conducted on geographies consisting of 451,614,723 people shows a moderate negative correlation between the proportion of Austrians and median family income in the United States with a correlation coefficient (R) of -0.405 and weighted average of $111,306. Similarly, the statistical analysis conducted on geographies consisting of 580,248,843 people shows a mild negative correlation between the proportion of Americans and median family income in the United States with a correlation coefficient (R) of -0.326 and weighted average of $92,096, a difference of 20.9%.
Median Family Income Correlation Summary
| Measurement | Austrian | American |
| Minimum | $63,235 | $2,499 |
| Maximum | $142,142 | $139,235 |
| Range | $78,907 | $136,736 |
| Mean | $100,879 | $73,235 |
| Median | $95,625 | $70,309 |
| Interquartile 25% (IQ1) | $82,447 | $63,060 |
| Interquartile 75% (IQ3) | $118,182 | $81,871 |
| Interquartile Range (IQR) | $35,735 | $18,811 |
| Standard Deviation (Sample) | $22,141 | $18,957 |
| Standard Deviation (Population) | $21,840 | $18,897 |
Similar Demographics by Median Family Income
Demographics Similar to Austrians by Median Family Income
In terms of median family income, the demographic groups most similar to Austrians are Immigrants from Hungary ($111,378, a difference of 0.060%), Croatian ($111,370, a difference of 0.060%), Ukrainian ($111,368, a difference of 0.060%), Romanian ($111,243, a difference of 0.060%), and Immigrants from Egypt ($111,689, a difference of 0.34%).
| Demographics | Rating | Rank | Median Family Income |
| Immigrants | Croatia | 99.3 /100 | #80 | Exceptional $112,323 |
| Immigrants | North America | 99.2 /100 | #81 | Exceptional $112,151 |
| Immigrants | England | 99.2 /100 | #82 | Exceptional $112,038 |
| Immigrants | Egypt | 99.0 /100 | #83 | Exceptional $111,689 |
| Immigrants | Hungary | 98.8 /100 | #84 | Exceptional $111,378 |
| Croatians | 98.8 /100 | #85 | Exceptional $111,370 |
| Ukrainians | 98.8 /100 | #86 | Exceptional $111,368 |
| Austrians | 98.8 /100 | #87 | Exceptional $111,306 |
| Romanians | 98.8 /100 | #88 | Exceptional $111,243 |
| Immigrants | Argentina | 98.5 /100 | #89 | Exceptional $110,873 |
| Northern Europeans | 98.3 /100 | #90 | Exceptional $110,635 |
| Immigrants | Southern Europe | 98.3 /100 | #91 | Exceptional $110,614 |
| Immigrants | Lebanon | 97.9 /100 | #92 | Exceptional $110,159 |
| Immigrants | Kazakhstan | 97.8 /100 | #93 | Exceptional $110,137 |
| Koreans | 97.8 /100 | #94 | Exceptional $110,103 |
Demographics Similar to Americans by Median Family Income
In terms of median family income, the demographic groups most similar to Americans are Nicaraguan ($92,231, a difference of 0.15%), Immigrants from Laos ($92,239, a difference of 0.16%), Osage ($91,926, a difference of 0.19%), Cape Verdean ($91,848, a difference of 0.27%), and Immigrants from Barbados ($92,419, a difference of 0.35%).
| Demographics | Rating | Rank | Median Family Income |
| West Indians | 0.6 /100 | #250 | Tragic $92,765 |
| Immigrants | Somalia | 0.6 /100 | #251 | Tragic $92,609 |
| Immigrants | El Salvador | 0.6 /100 | #252 | Tragic $92,545 |
| Immigrants | Guyana | 0.6 /100 | #253 | Tragic $92,513 |
| Immigrants | Barbados | 0.5 /100 | #254 | Tragic $92,419 |
| Immigrants | Laos | 0.5 /100 | #255 | Tragic $92,239 |
| Nicaraguans | 0.5 /100 | #256 | Tragic $92,231 |
| Americans | 0.4 /100 | #257 | Tragic $92,096 |
| Osage | 0.4 /100 | #258 | Tragic $91,926 |
| Cape Verdeans | 0.4 /100 | #259 | Tragic $91,848 |
| Pennsylvania Germans | 0.4 /100 | #260 | Tragic $91,763 |
| Inupiat | 0.4 /100 | #261 | Tragic $91,730 |
| Liberians | 0.4 /100 | #262 | Tragic $91,722 |
| Immigrants | West Indies | 0.3 /100 | #263 | Tragic $91,588 |
| Senegalese | 0.3 /100 | #264 | Tragic $91,475 |