Cypriot vs Thai Disability Age 65 to 74
COMPARE
Cypriot
Thai
Disability Age 65 to 74
Disability Age 65 to 74 Comparison
Cypriots
Thais
20.1%
DISABILITY AGE 65 TO 74
100.0/ 100
METRIC RATING
7th/ 347
METRIC RANK
20.1%
DISABILITY AGE 65 TO 74
100.0/ 100
METRIC RATING
8th/ 347
METRIC RANK
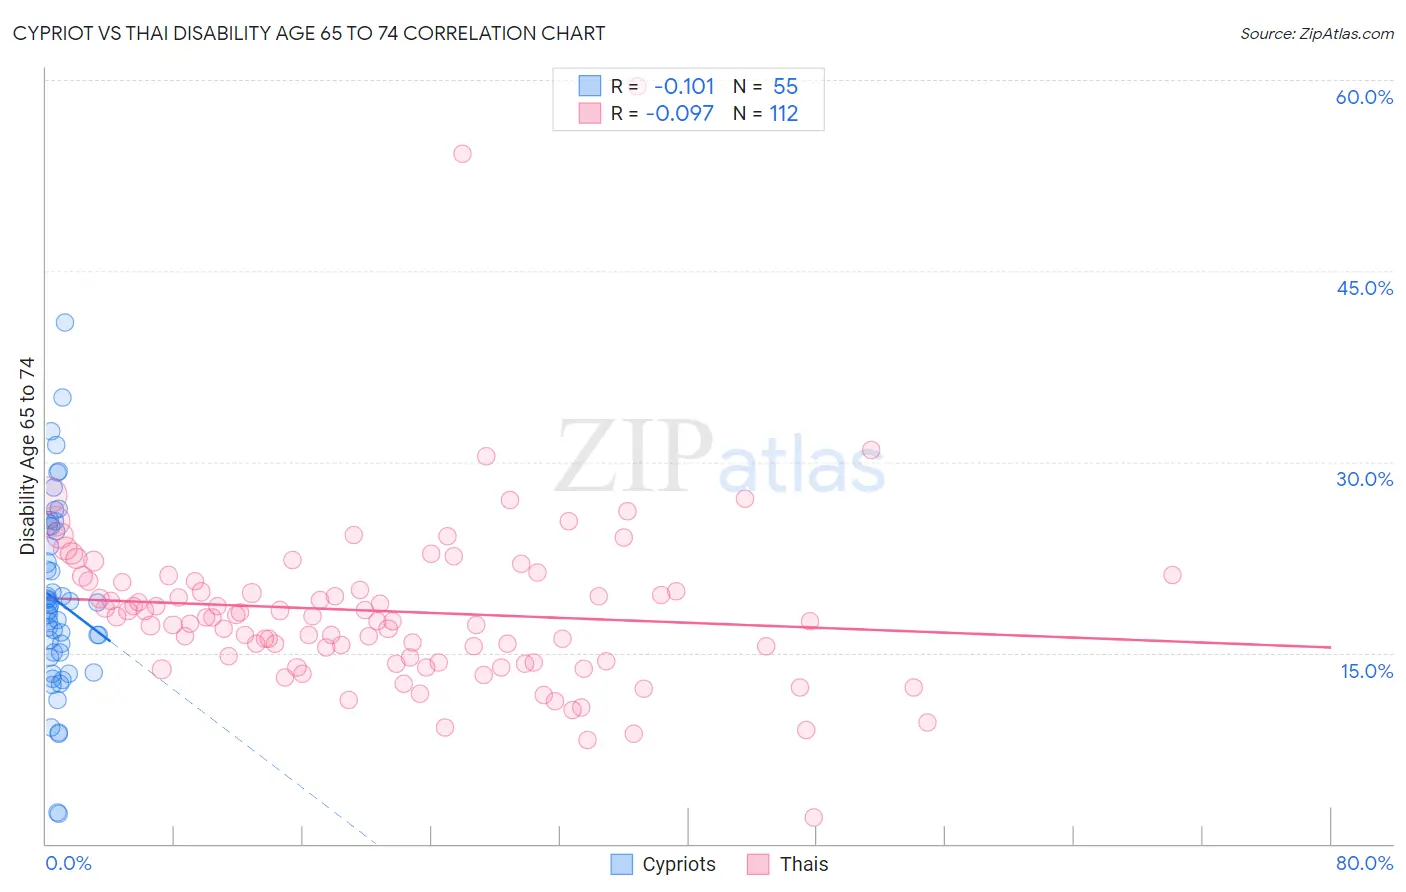
Cypriot vs Thai Disability Age 65 to 74 Correlation Chart
The statistical analysis conducted on geographies consisting of 61,803,006 people shows a poor negative correlation between the proportion of Cypriots and percentage of population with a disability between the ages 65 and 75 in the United States with a correlation coefficient (R) of -0.101 and weighted average of 20.1%. Similarly, the statistical analysis conducted on geographies consisting of 474,585,804 people shows a slight negative correlation between the proportion of Thais and percentage of population with a disability between the ages 65 and 75 in the United States with a correlation coefficient (R) of -0.097 and weighted average of 20.1%, a difference of 0.040%.
Disability Age 65 to 74 Correlation Summary
| Measurement | Cypriot | Thai |
| Minimum | 2.3% | 2.1% |
| Maximum | 41.0% | 59.5% |
| Range | 38.6% | 57.4% |
| Mean | 19.1% | 18.3% |
| Median | 18.4% | 17.6% |
| Interquartile 25% (IQ1) | 14.6% | 14.3% |
| Interquartile 75% (IQ3) | 24.6% | 20.6% |
| Interquartile Range (IQR) | 9.9% | 6.3% |
| Standard Deviation (Sample) | 7.4% | 7.1% |
| Standard Deviation (Population) | 7.4% | 7.1% |
Demographics Similar to Cypriots and Thais by Disability Age 65 to 74
In terms of disability age 65 to 74, the demographic groups most similar to Cypriots are Iranian (19.9%, a difference of 0.67%), Immigrants from Israel (19.9%, a difference of 0.78%), Immigrants from China (20.3%, a difference of 0.99%), Immigrants from Eastern Asia (20.3%, a difference of 1.1%), and Immigrants from Hong Kong (19.9%, a difference of 1.1%). Similarly, the demographic groups most similar to Thais are Iranian (19.9%, a difference of 0.70%), Immigrants from Israel (19.9%, a difference of 0.82%), Immigrants from China (20.3%, a difference of 0.96%), Immigrants from Eastern Asia (20.3%, a difference of 1.0%), and Immigrants from Hong Kong (19.9%, a difference of 1.1%).
| Demographics | Rating | Rank | Disability Age 65 to 74 |
| Immigrants | Taiwan | 100.0 /100 | #1 | Exceptional 18.8% |
| Filipinos | 100.0 /100 | #2 | Exceptional 19.0% |
| Immigrants | India | 100.0 /100 | #3 | Exceptional 19.7% |
| Immigrants | Hong Kong | 100.0 /100 | #4 | Exceptional 19.9% |
| Immigrants | Israel | 100.0 /100 | #5 | Exceptional 19.9% |
| Iranians | 100.0 /100 | #6 | Exceptional 19.9% |
| Cypriots | 100.0 /100 | #7 | Exceptional 20.1% |
| Thais | 100.0 /100 | #8 | Exceptional 20.1% |
| Immigrants | China | 100.0 /100 | #9 | Exceptional 20.3% |
| Immigrants | Eastern Asia | 100.0 /100 | #10 | Exceptional 20.3% |
| Immigrants | Ireland | 100.0 /100 | #11 | Exceptional 20.3% |
| Immigrants | Korea | 100.0 /100 | #12 | Exceptional 20.4% |
| Immigrants | Singapore | 100.0 /100 | #13 | Exceptional 20.4% |
| Indians (Asian) | 100.0 /100 | #14 | Exceptional 20.5% |
| Paraguayans | 100.0 /100 | #15 | Exceptional 20.5% |
| Immigrants | Lithuania | 100.0 /100 | #16 | Exceptional 20.5% |
| Immigrants | South Central Asia | 100.0 /100 | #17 | Exceptional 20.6% |
| Eastern Europeans | 100.0 /100 | #18 | Exceptional 20.6% |
| Burmese | 100.0 /100 | #19 | Exceptional 20.6% |
| Okinawans | 100.0 /100 | #20 | Exceptional 20.7% |