Iranian vs Romanian Vision Disability
COMPARE
Iranian
Romanian
Vision Disability
Vision Disability Comparison
Iranians
Romanians
1.8%
VISION DISABILITY
100.0/ 100
METRIC RATING
8th/ 347
METRIC RANK
2.1%
VISION DISABILITY
95.7/ 100
METRIC RATING
96th/ 347
METRIC RANK
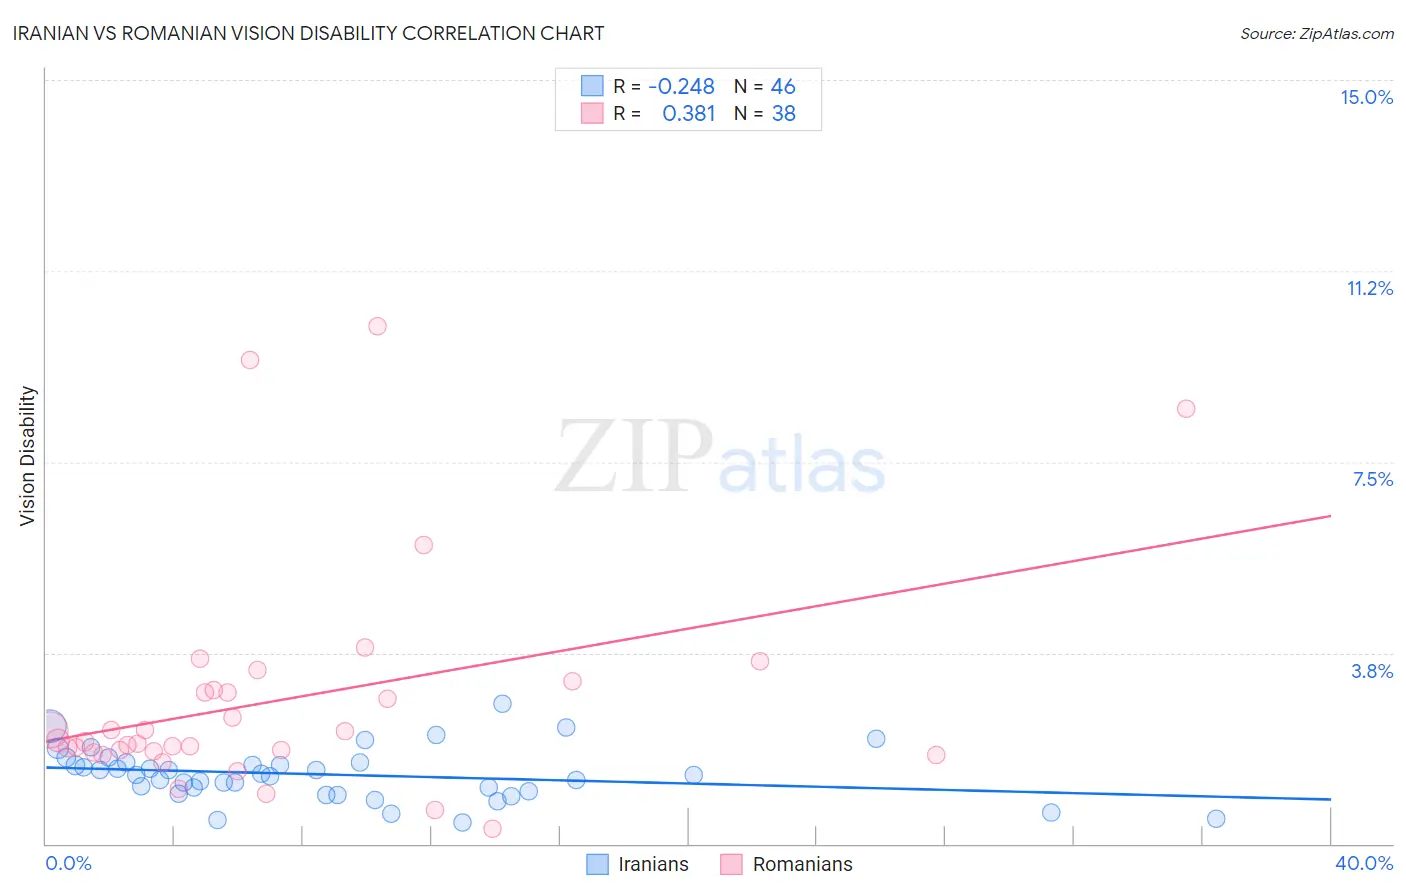
Iranian vs Romanian Vision Disability Correlation Chart
The statistical analysis conducted on geographies consisting of 316,677,046 people shows a weak negative correlation between the proportion of Iranians and percentage of population with vision disability in the United States with a correlation coefficient (R) of -0.248 and weighted average of 1.8%. Similarly, the statistical analysis conducted on geographies consisting of 377,620,863 people shows a mild positive correlation between the proportion of Romanians and percentage of population with vision disability in the United States with a correlation coefficient (R) of 0.381 and weighted average of 2.1%, a difference of 15.2%.
Vision Disability Correlation Summary
| Measurement | Iranian | Romanian |
| Minimum | 0.41% | 0.28% |
| Maximum | 2.8% | 10.2% |
| Range | 2.3% | 9.9% |
| Mean | 1.4% | 2.8% |
| Median | 1.4% | 2.0% |
| Interquartile 25% (IQ1) | 1.0% | 1.8% |
| Interquartile 75% (IQ3) | 1.6% | 3.0% |
| Interquartile Range (IQR) | 0.57% | 1.2% |
| Standard Deviation (Sample) | 0.51% | 2.2% |
| Standard Deviation (Population) | 0.50% | 2.2% |
Similar Demographics by Vision Disability
Demographics Similar to Iranians by Vision Disability
In terms of vision disability, the demographic groups most similar to Iranians are Immigrants from South Central Asia (1.8%, a difference of 0.15%), Immigrants from Iran (1.8%, a difference of 0.21%), Immigrants from Singapore (1.8%, a difference of 0.74%), Okinawan (1.8%, a difference of 0.80%), and Immigrants from Hong Kong (1.8%, a difference of 0.93%).
| Demographics | Rating | Rank | Vision Disability |
| Immigrants | India | 100.0 /100 | #1 | Exceptional 1.7% |
| Filipinos | 100.0 /100 | #2 | Exceptional 1.7% |
| Immigrants | Taiwan | 100.0 /100 | #3 | Exceptional 1.7% |
| Thais | 100.0 /100 | #4 | Exceptional 1.7% |
| Okinawans | 100.0 /100 | #5 | Exceptional 1.8% |
| Immigrants | Iran | 100.0 /100 | #6 | Exceptional 1.8% |
| Immigrants | South Central Asia | 100.0 /100 | #7 | Exceptional 1.8% |
| Iranians | 100.0 /100 | #8 | Exceptional 1.8% |
| Immigrants | Singapore | 100.0 /100 | #9 | Exceptional 1.8% |
| Immigrants | Hong Kong | 100.0 /100 | #10 | Exceptional 1.8% |
| Immigrants | Israel | 100.0 /100 | #11 | Exceptional 1.8% |
| Immigrants | Korea | 100.0 /100 | #12 | Exceptional 1.8% |
| Immigrants | Eastern Asia | 100.0 /100 | #13 | Exceptional 1.8% |
| Immigrants | China | 100.0 /100 | #14 | Exceptional 1.8% |
| Immigrants | Bolivia | 100.0 /100 | #15 | Exceptional 1.8% |
Demographics Similar to Romanians by Vision Disability
In terms of vision disability, the demographic groups most similar to Romanians are Australian (2.1%, a difference of 0.060%), Immigrants from Afghanistan (2.1%, a difference of 0.070%), Immigrants from South Africa (2.1%, a difference of 0.11%), Immigrants from Croatia (2.1%, a difference of 0.13%), and Immigrants from Europe (2.1%, a difference of 0.15%).
| Demographics | Rating | Rank | Vision Disability |
| Immigrants | Eastern Africa | 97.0 /100 | #89 | Exceptional 2.0% |
| Immigrants | Lebanon | 96.7 /100 | #90 | Exceptional 2.1% |
| Immigrants | Somalia | 96.2 /100 | #91 | Exceptional 2.1% |
| Immigrants | Syria | 96.2 /100 | #92 | Exceptional 2.1% |
| Immigrants | Europe | 96.1 /100 | #93 | Exceptional 2.1% |
| Immigrants | Croatia | 96.0 /100 | #94 | Exceptional 2.1% |
| Australians | 95.9 /100 | #95 | Exceptional 2.1% |
| Romanians | 95.7 /100 | #96 | Exceptional 2.1% |
| Immigrants | Afghanistan | 95.6 /100 | #97 | Exceptional 2.1% |
| Immigrants | South Africa | 95.4 /100 | #98 | Exceptional 2.1% |
| Estonians | 95.3 /100 | #99 | Exceptional 2.1% |
| Greeks | 95.1 /100 | #100 | Exceptional 2.1% |
| Albanians | 94.9 /100 | #101 | Exceptional 2.1% |
| Sri Lankans | 94.8 /100 | #102 | Exceptional 2.1% |
| Immigrants | Austria | 94.4 /100 | #103 | Exceptional 2.1% |